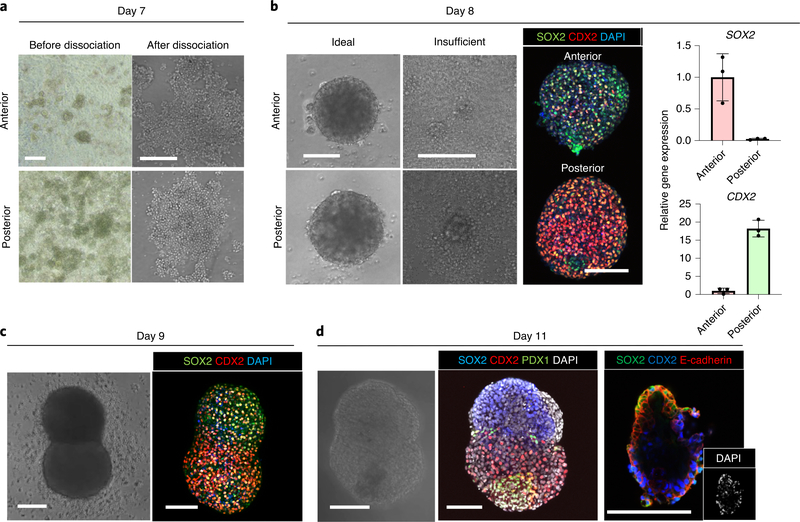
Fig. 3 |. Representative images of anterior or posterior gut cells and boundary organoids.
a, Typical morphology of monolayer anterior and posterior gut cells and the image of detached cells seeded on a low-attachment, 96-well plate at day 7. b, Successfully formed spheroids at day 8. Left: the image of spheroids generated under ideal conditions or insufficient culture conditions. Middle: whole-mount immunostaining of successfully formed spheroids for SOX2 and CDX2. Right: qPCR for SOX2 and CDX2. Data are means ± s.d.; n = 3 independent experiments. Unpaired, two-tailed t-test. c, Anterior and posterior boundary organoid at day 9. Right: whole-mount immunostaining for SOX2 and CDX2 of fused organoids. d, Generated boundary organoid at day 11. Whole-mount immunostaining for SOX2, CDX2 and PDX1 shows the PDX1 emergence at the boundary of the fused organoid. Scale bars, 200 μm (a) and 100 μm (b–d).

