Figure 6.
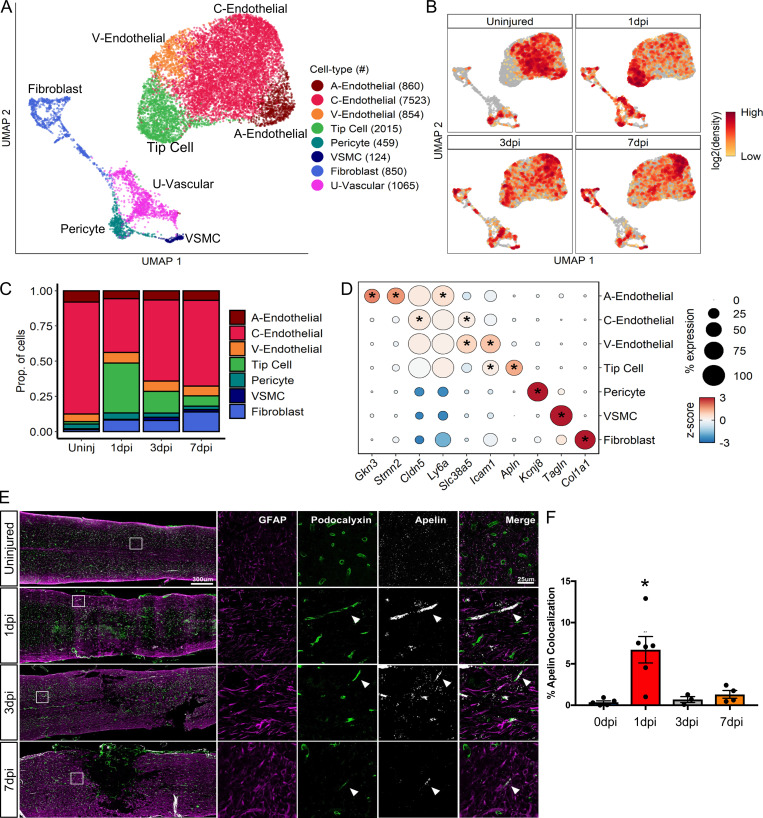
Molecular and temporal profile of vascular cell subtype heterogeneity acutely after SCI.(A) UMAP plot of all vascular cells from uninjured spinal cord and 1, 3, and 7 dpi. Fibroblasts, endothelial cells, and pericytes (Fig. 1 A) were extracted, reclustered, and re-embedded in new UMAP coordinates. Cells are colored by vascular subtype as shown in the legend on the right. Cell counts in parentheses. Subtypes were annotated using a combination of DEGs, canonical marker genes, and previously published data (Fig. S3). (B) UMAP of vascular cells split by each time point. Cells are colored by neighborhood density in UMAP space to illustrate shifts over time. Darker red colors indicate greater cell density in the UMAP or gray if not from indicated time point. (C) Proportion of each vascular subtype at each time point among all vascular cells except for a U-vascular subtype. (D) Dot plot of marker genes that differentiate vascular subtypes. Color of dots represents z-scored expression level, and size of dots represents percentage of cells with at least one UMI detected per gene. Inset stars indicate statistically significantly greater expression compared with all other cells combined (adjusted P value < 10−10; Wilcoxon rank-sum with Bonferroni correction; see Materials and methods). (E) Histological validation of the temporal progression of tip cells at the injury site. Uninjured, 1, 3, and 7 dpi spinal cord sections were assessed by immunohistochemistry for podocalyxin (green) to label endothelial cells and for GFAP (purple) to label astrocytes and delineate the injury site. In situ hybridization was used for apelin mRNA (Apln; white puncta) to label tip cells. White box represents the corresponding region of the magnified images on the right. Arrowheads identify tip cells that coexpress podocalyxin and apelin. (F) Quantification of histological analysis represented as the average percent area of apelin and podocalyxin colocalization relative to the entire podocalyxin-positive area. Dots represent individual biological replicates. n = 3–6 mice per time point. Error bars, SEM. *, P < 0.05 compared with all other time points; one-way ANOVA with Bonferroni multiple comparisons. A, arterial; C, capillary; Prop., proportion; Uninj, uninjured; U, unknown; V, venous; VSMC, vascular smooth muscle cell.

