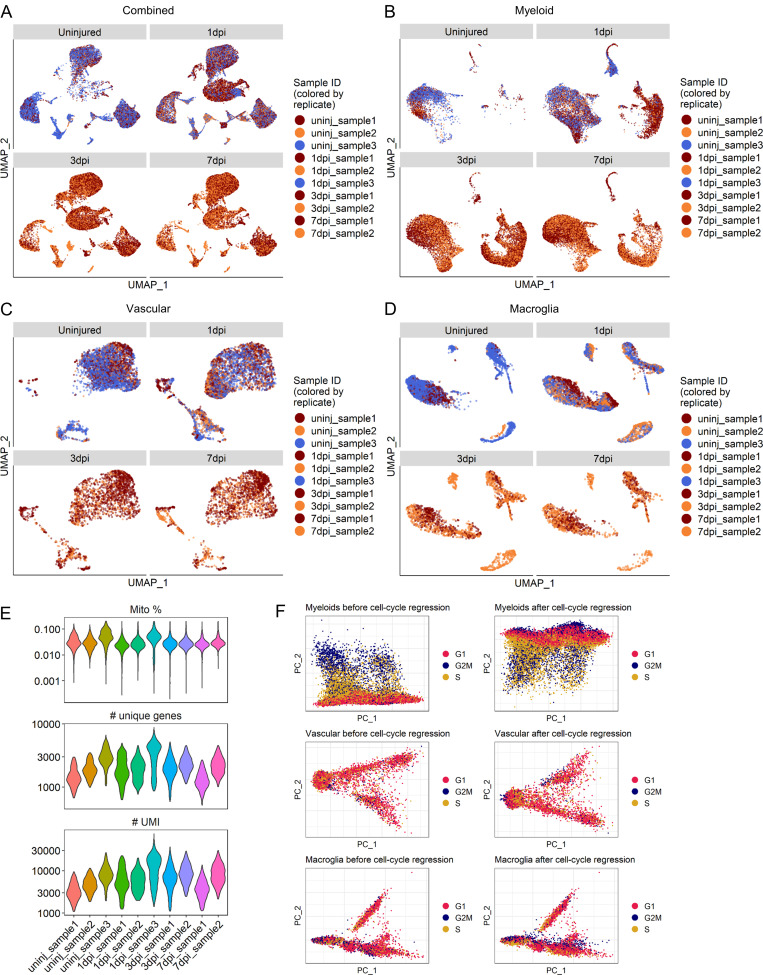
Figure S1.
Sample distribution, quality control metrics, and effect of cell cycle regression.(A–D) UMAP of all cells (A), myeloid cells (B), vascular cells (C), and macroglia cells (D) across all injury time points. Cells are colored by replicate for each injury time point. n = 3 replicates for uninjured and 1 dpi time points and n = 2 for 3 and 7 dpi time points (i.e., uninjured and 1-dpi UMAPs have three colors while 3- and 7-dpi UMAPs have two colors). (E) Sequencing and quality control metrics by sample. Distributions shown are for cells that were retained following removal of low-quality cells. Top: Number of UMIs detected per cell. Middle: Number of unique genes detected per cell. Bottom: Percentage of UMIs that maps to a mitochondrial protein–encoding gene per cell. (F) Plots of first two principal components for each cell group category show separation by cell cycle phase for myeloid cells but not vascular or macroglial cells. Cells are colored by predicted phases using the Seurat CellCycleScoring() function. Cell cycle regression of myeloid cells removed separation between cells in S and G2M phases. Cell cycle regression of vascular and macroglial cells had little to no effect. Mito, mitochondrial; PC, principal component; uninj, uninjured.

