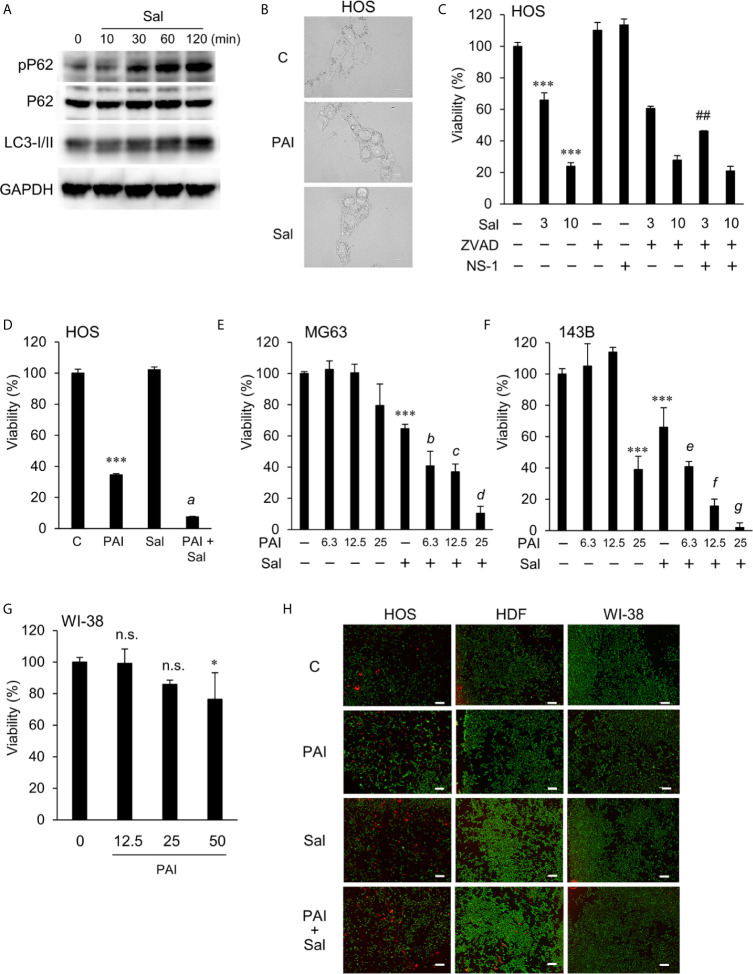
Figure 4.
PAI and Sal mutually act as adjuvant in a tumor-specific manner. (A) LM8 cells were treated with Sal (1 μM) for the indicated time and then analyzed for the expression of phosphorylated P62, P62, and LC3-I/II by western blotting analysis using specific antibodies. GAPDH was used as the loading control. See Supplementary Figure 5 for examples of uncropped images and quantification for each antibody. (B) HOS cells were treated with PAI (25%) and Sal (3 μM) for 18 h and observed under a BZX-710 digital biological microscope equipped with a 100×coverslip-corrected oil objective and were analyzed using BZ-H3A application software. Bar = 10 μm. (C) HOS cells were treated with Sal (3, 10 μM) alone or in combination with ZVAD-FMK (ZVAD, 10 μM) or necrostatin-1 (NS-1, 30 μM) for 72 h, and were measured for cell viability using the WST-8 assay. (D) HOS cells were treated with PAI (25%) and Sal (1 μM) alone or in combination for 72 h and were measured for cell viability using the WST-8 assay. Data were analyzed by one-way analysis of variance followed by Tukey’s post hoc test. ***P < 0.001 vs. control; a, P < 0.001 vs. PAI or Sal alone. (E, F) (E) MG63 and (F) 143B cells were treated with PAI at the indicated concentrations and Sal (3 μM) alone or in combination for 72 h and were measured for cell viability using the WST-8 assay. ***P < 0.001 vs. control. b, *P < 0.05; c, ***P < 0.001; vs. Sal alone. e, *P < 0.05; f, g, ***P < 0.001; vs. Sal alone. (G) WI-38 cells were treated with PAI at the indicated concentrations for 72 h and were measured for cell viability using the WST-8 assay. *P < 0.05; n.s., not significant, vs. control. (H) HOS, human dermal fibroblasts, and WI-38 cells were treated with PAI (25%) and Sal (3 μM) alone or in combination for 18 h and were measured for calcein-AM and ethidium bromide homodimer-1 (EthD-1) staining. Live cells were stained green with calcein, whereas dead/damaged cells were stained red with EthD-1. Color images were obtained using a BZX-710 digital biological microscope equipped with a 40× objective and were analyzed using the BZ-H3A application software. Zoomed images represent the magnification of the representative images in the box. Bar = 300 μm. Cells positive for EthD-1 were counted and quantified in Supplementary Figure 6 . ## P < 0.01 vs. Sal + ZVAD.

