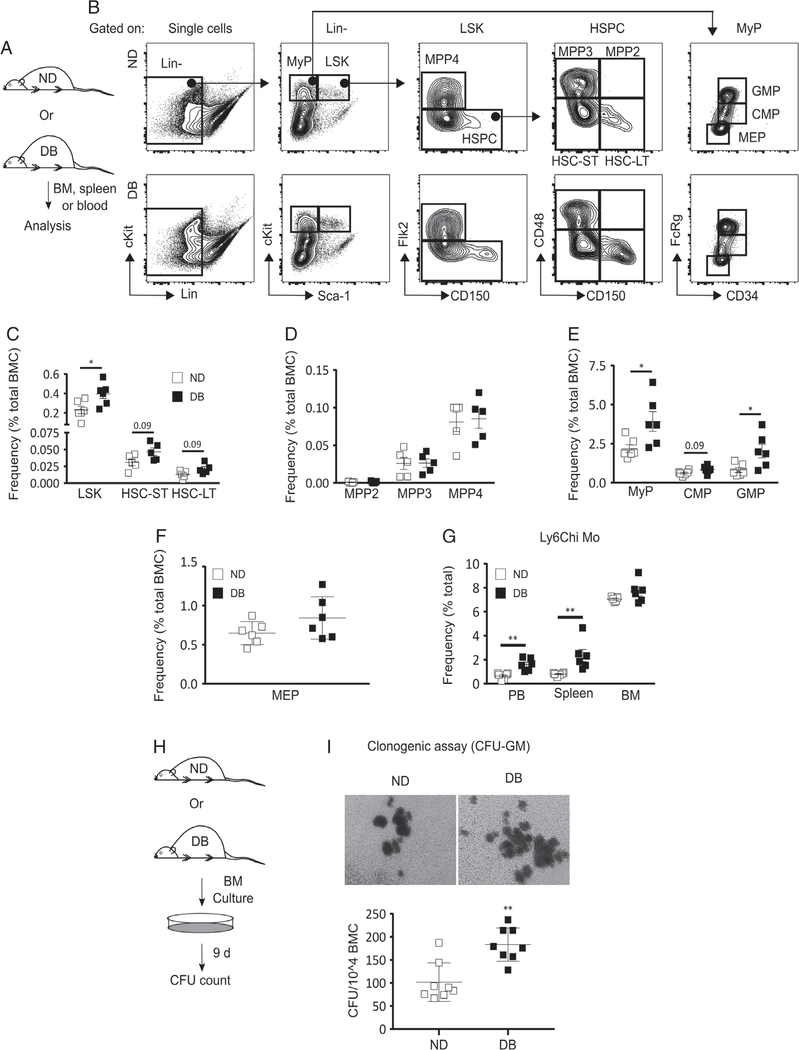
Figure 1.
T2D preprograms HSPCs towards myeloid differentiation at baseline. (A) Experimental design. (B) Representative flow cytograms showing the gating strategy for flow cytometry analysis of HSPC and MyP subsets in the BM of DB and ND mice. Percentage [of total BM cells (BMC)] of (C) LSK (Lin−Sca-1+cKit+), HSC-ST (Lin−Sca-1+cKit+Flk2−CD48−CD150−), and HSC-LT (Lin−Sca-1+cKit+Flk2−CD48−CD150+); (D) MPP2 (Lin−Sca-1+cKit+Flk−CD150+CD48+), MPP3 (Lin−Sca-1+cKit+Flk−CD150−CD48+), and MPP4 (Lin−Sca-1+cKit+Flk−CD150−); (E) MyP (Lin−Sca-1−cKit+), CMP (Lin−Sca-1−cKit+FcRγloCD34+), and GMP (Lin−Sca-1−cKit+FcRγhiCD34+); and (F) MEP (Lin−Sca-1−cKit+FcRγloCD34−) in DB and ND BM. (G) Percentage (of total cells) of Ly6Chi Mo (Ly6G−CD11b+Ly6Chi) in BM, peripheral blood (PB), and spleen of DB and ND mice. (H, I) Clonogenic assay: (H) experimental design and (I) representative culture photographs (upper panel) and number of colony-forming units (CFU) per 104 BMC (lower panel) in BM culture from DB and ND mice. Mean±SD, n=5–6 (A–G) and 4 mice in duplicate (H, I) for each strain. Data were compared between DB and ND groups using the Mann–Whitney U-test. Differences between groups were considered significant if p≤0.05. *p≤0.05; **p≤0.01.

