
FIGURE 2.
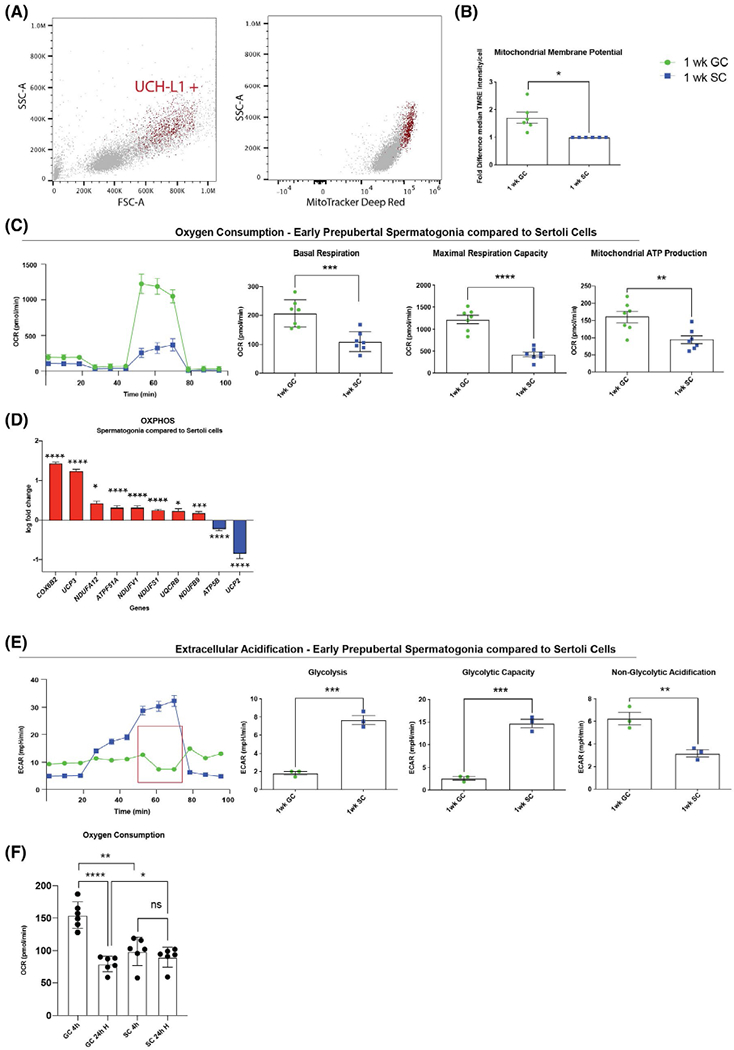
Early prepubertal pig spermatogonia have high mitochondrial activity and low glycolytic capacity. A, Undifferentiated spermatogonia (UCH-L1+ red) can be identified in a cell population isolated from seminiferous tubules (grey) by light scatter properties, UCH-L1+ cells are MitoTracker Deep Red high and show higher mitochondrial membrane potential than UCH-L1− somatic cells (early prepubertal spermatogonia in red versus testicular somatic cells, majority Sertoli cells, in grey, mean ± SEM of median intensity 126,928 ± 2531 vs 29,553 ± 6070 P = .0001, n = 3 technical replicates, two-tailed, unpaired Student’s t test). B, Early prepubertal spermatogonia (1-week-old GC) have higher mitochondrial membrane potential than early prepubertal Sertoli cells (1-week-old SC) (mean ± SEM of median intensity of TMRE in flow cytometry n = 6; P = .02, unpaired Student’s t test with Welch’s-correction). C, Early prepubertal spermatogonia (green) have higher oxygen consumption rate (OCR) than Sertoli cells (blue) (representative illustration of one biological replicate for OCR assay with the Seahorse Flux Analyzer, mean ± SD, 10 technical replicates); quantification shown as pmol/min/well of 150,000 cells, mean ± SEM; basal respiration (P = .0008, n = 7); maximum respiration capacity (P < .0001, n = 7); and mitochondrial ATP production (P = .006, n = 7) (two-tailed, unpaired Student’s t test). D, Early prepubertal spermatogonia show significant upregulation in 8 out of 10 differentially expressed genes compared to Sertoli cells (data shown in log fold change compared to Sertoli cell Δct mean, n = 4, P < .05). E, Early prepubertal spermatogonia have lower glycolytic activity than Sertoli cells (representative illustration of one biological replicate for extracellular acidification rate [ECAR] assay with the Seahorse Flux Analyzer, mean ± SD of 10 technical replicates); quantification shown as mpH/min/well of 150 000 cells, mean ± SEM, of glycolysis (P = .0004, n = 3); glycolytic capacity (P = .0003, n = 3) and nonglycolytic acidification (P = .0084, n = 3). F, Early prepubertal spermatogonia have significantly higher OCR than Sertoli cells at normoxia (mean ± SEM, P = .0011, n = 6) but have significantly lower OCR than Sertoli cells after 24 hours of hypoxia (mean ± SEM, P = .0411, n = 6) and do not recover to the initial OCR after hypoxia (mean ± SEM, P < .0001, n = 6). Sertoli cells do not show a change in OCR after exposure to hypoxia (mean ± SEM, P = .14, n = 6; two-tailed, unpaired Student’s t test and nonparametric t test