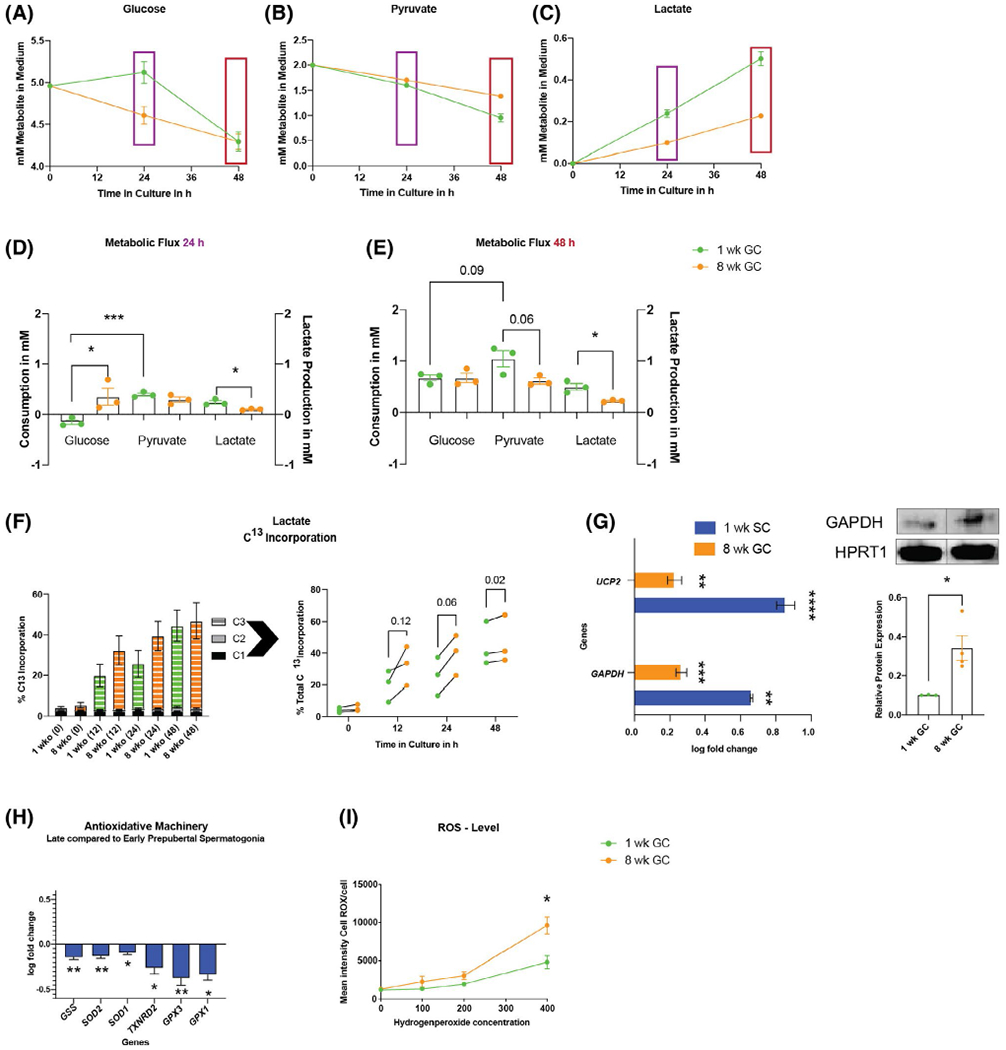
FIGURE 5.

Late prepubertal spermatogonia show a metabolic transition with upregulation of GAPDH and UCP2 and increased sensitivity towards ROS. (A-C) Representative time course of glucose (A), pyruvate (B) consumption, and lactate production (C) in sorted early and late prepubertal spermatogonia in culture. D-E, Mean ± SEM of mM metabolite consumed (left y-axis) (two-tailed, unpaired nested Student’s t test) and lactate produced (right y-axis) at 24 hours (purple) and 48 hours (red) of culture (two-tailed, unpaired Student’s t test). F, Percent U-C13 incorporation into lactate for early (green) versus late (orange) prepubertal spermatogonia (stacked values for C1, C2, and C3 incorporation and individual replicates connected with a line for biological replicates of the two ages harvested the same day (values of total incorporation, n = 3; P values for fold difference, t0: 1.32 ± 0.13, P = .12; t12: 1.77 ± 0.52, P = .12; t24: 1.63 ± 0.17, P = .06; t48: 1.052 ± 0.01, P = .02). (G) Upregulation of GAPDH and UCP2 in Sertoli cells (1-week SC) and late prepubertal spermatogonia (8-week GC) compared to early prepubertal spermatogonia (mean ± SEM log fold change compared to mean Δct of early prepubertal spermatogonia; statistics performed on raw Δct, P < .05, n = 4; Table S1); late prepubertal spermatogonia have more GAPDH protein than early prepubertal spermatogonia relative to house keeping protein HPRT1 (outlier identified via ROUT method, mean ± SEM, 0.343 ± 0.065 vs 0.103 ± 0.001 P = .034, n = 3–4). H, Late prepubertal spermatogonia show significant downregulation of all differentially expressed antioxidative enzymes (P < .05, n = 4, Table S1). I, Late prepubertal spermatogonia have lower oxidative resistance at high concentrations of hydrogen peroxide (mean ± SEM of median intensity of CellROX Green in flow cytometry after increasing concentrations of H2O2 from 0 to 400 μMol; n400 of H2O2 (P = .0268, n = 3) (two-tailed, unpaired Student’s t test)
