
Fig 1.
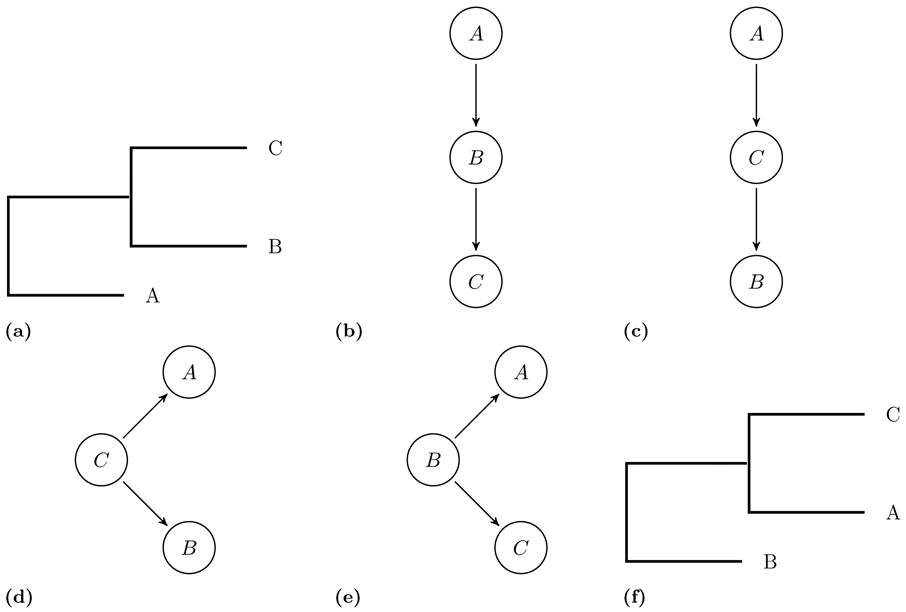
The graphical representations of a) the phylogenetic tree (A, (B, C)), transmission trees b) {A → B, B → C}, c) {A → C, C → B}, d) {C → A, C → B}, e) {B → A, B → C} and f) the phylogenetic tree (B, (A, C)).
Official websites use .gov
A
.gov website belongs to an official
government organization in the United States.
Secure .gov websites use HTTPS
A lock (
) or https:// means you've safely
connected to the .gov website. Share sensitive
information only on official, secure websites.
The graphical representations of a) the phylogenetic tree (A, (B, C)), transmission trees b) {A → B, B → C}, c) {A → C, C → B}, d) {C → A, C → B}, e) {B → A, B → C} and f) the phylogenetic tree (B, (A, C)).