
Figure 1.
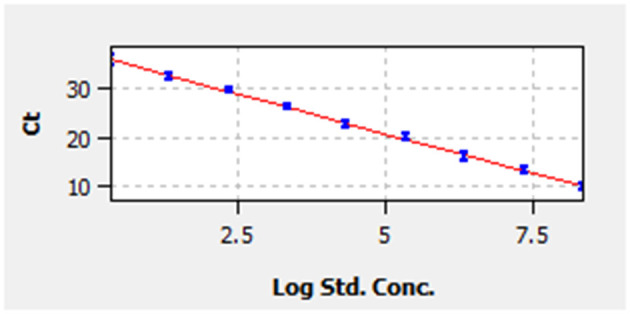
Standard curve. Correlation between cycle threshold value (y-axis) and the logarithm of concentration of 10-fold-diluted pMD19-bovine rhinitis B virus (BRBV) (x-axis). The x-axis in the graph starts from the logarithm of concentration of 2.23 × 100 copies/μl. The standard equation is y = −3.29 × Lg Con. + 37.17.