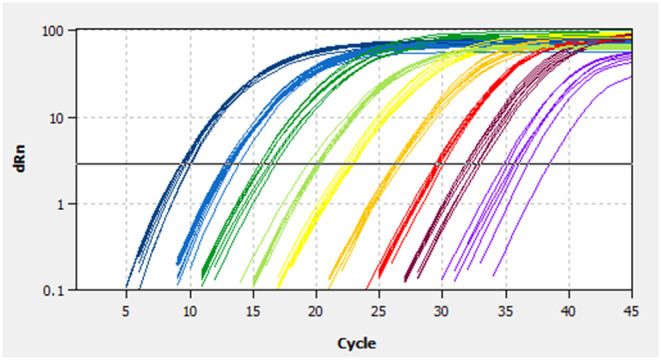
Figure 2.

Fluorescence spectra for the standard curve. Fluorescence curves of different colors represent different concentrations of pMD19-BRBV. The concentrations were 2.23 × 10⁸ to 2.23 × 100 copies/μl from left to right, respectively. dRn, the fluorescence intensity data standardized to the value 100 for highest fluorescence intensity.
