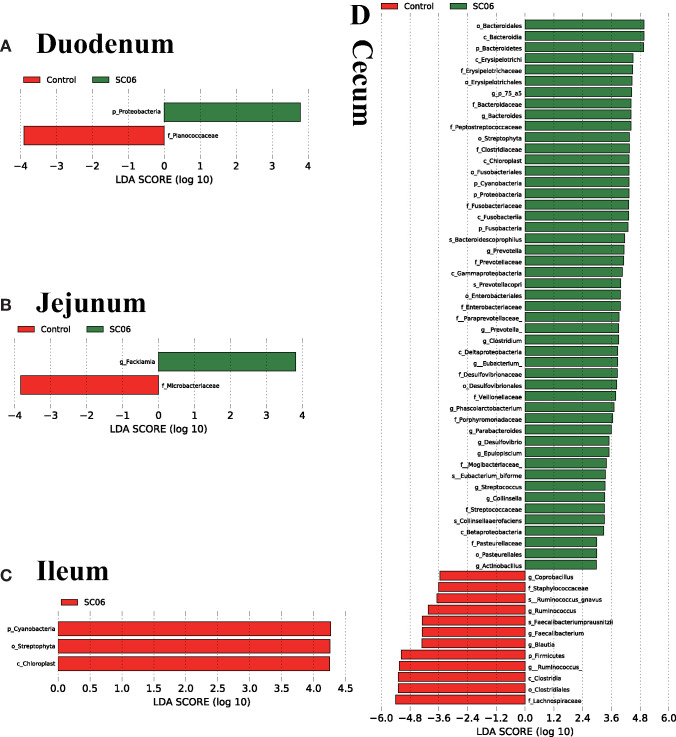
Figure 4.
Linear discriminant analysis (LDA) effect size (LEfSe) analysis (P < 0.05, LDA >2.0) showing the biomarker taxa (n = 3 birds/group). The prefixes “p,” “c,” “o,” “f,” “g,” and “s” represent the annotated levels of phylum, class, order, family, genus, and species. (A) duodenum, (B) jejunum, (C) ileum, (D) cecum.

