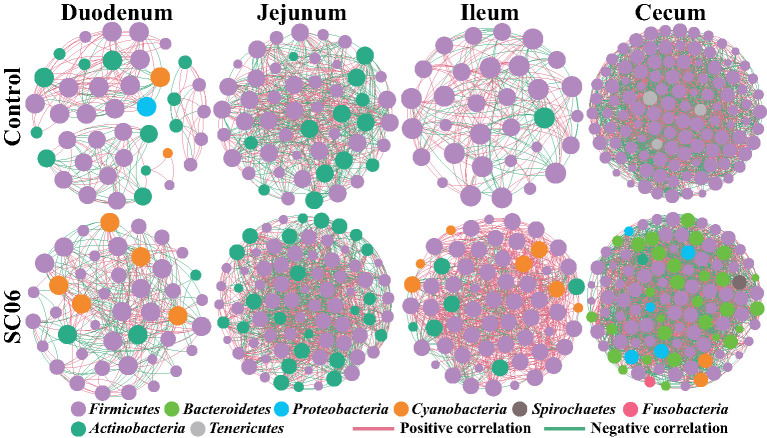
Figure 6.
Co-occurrence networks of microbial communities based on Spearman correlation analysis sorted in color by operational taxonomic unit (OTU) level. A connection stands for a very strong (Spearman's R > 0.6) and significant [false discovery rate (FDR)-adjusted P < 0.05] correlation. The size of each node is proportional to the relative abundance; the thickness of each connection between two nodes is proportional to the value of Spearman's correlation coefficients. Red lines represent significant positive correlations, and green lines denote negative correlations.

