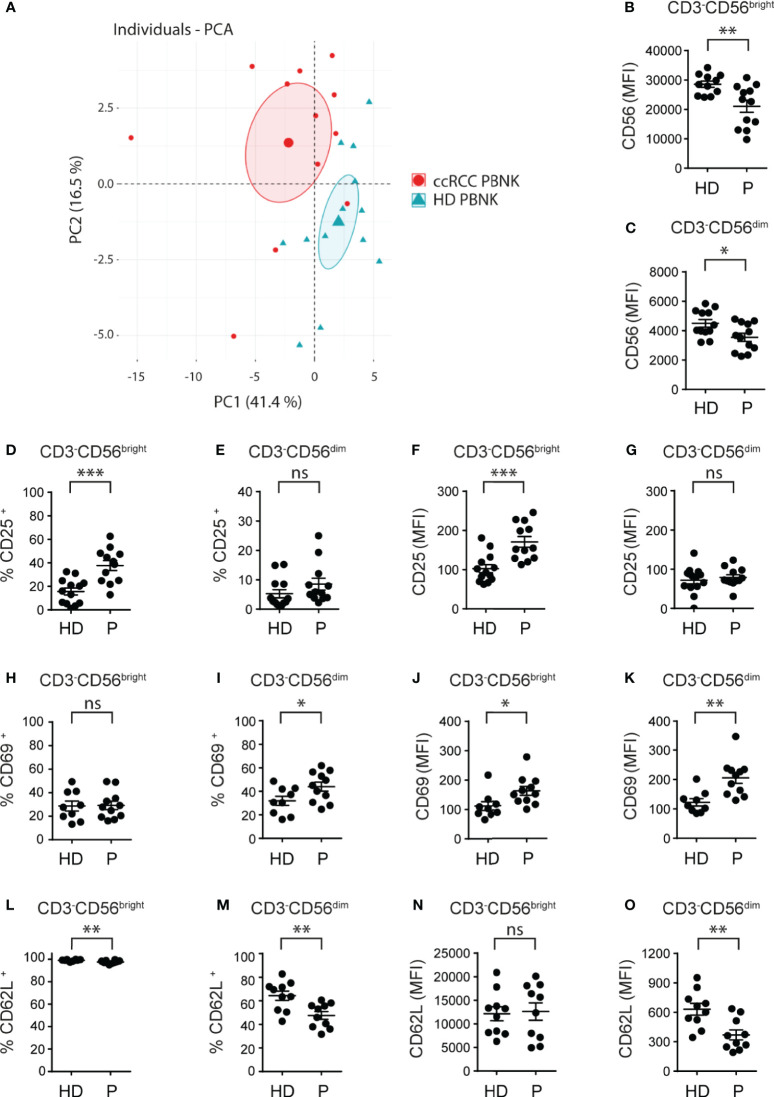
Figure 1.
Cell surface markers differentiate ccRCC patients from HD and indicate that PBNK from ccRCC patients exhibit an activated phenotype. MFI of the molecules analyzed on CD3-CD56bright and CD3-CD56dim cells of HD and ccRCC PBNK were used to perform a PCA (A). The graph of individuals with the confidence ellipse is shown. Also, PBNK cells from healthy donors (HD) and ccRCC patients (P) were analyzed by FC to compare the intensity of expression of CD56 on CD3-CD56bright (B) and on CD3-CD56dim NK cells (C), the frequencies of CD25+ cells in CD3-CD56bright (D) and in CD3-CD56dim NK cells (E), the intensity of expression of CD25 on CD3-CD56bright (F) and on CD3-CD56dim NK cells (G), the frequencies of CD69+ cells in CD3-CD56bright (H) and in CD3-CD56dim NK cells (I), the intensity of expression of CD69 on CD3-CD56bright (J) and on CD3-CD56dim NK cells (K), the frequencies of CD62L+ cells in CD3-CD56bright (L) and in CD3-CD56dim NK cells (M), and the intensity of expression of CD62L on CD3-CD56bright (N) and on CD3-CD56dim NK cells (O). For HD: n=11 (B), n=12 (C); n=13 (D–G); n=9 (H–K) and n=10 (L–O). For P: n=12 (B–G), n=11 (H–K), and n=10 (L–O). A two-sided unpaired t-test with Welch’s correction was used in (B–D, F–I, K–O). A two-sided unpaired t-test with Mann-Whitney´s correction was used in (E, J). ns, not significant; *p < 0.05; **p < 0.01; ***p < 0.001.

