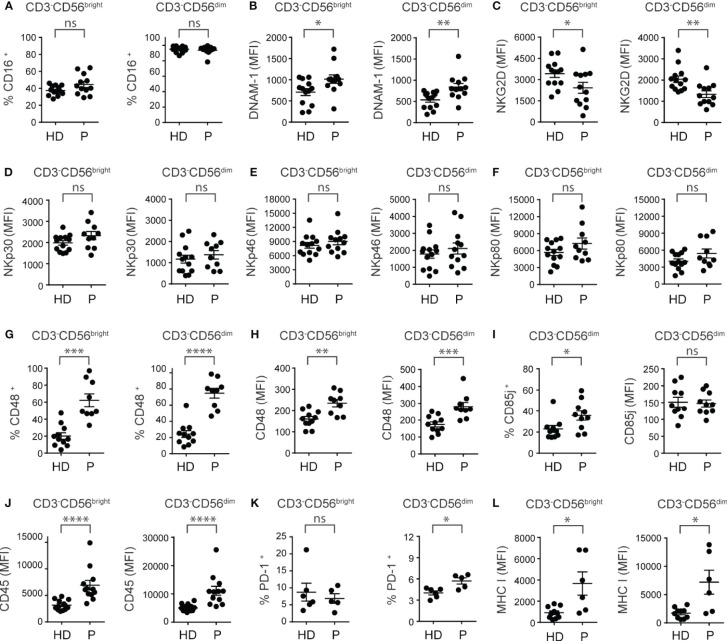
Figure 2.
PBNK from ccRCC patients exhibit an altered phenotype characterized by a dysregulation in the expression of activating and inhibitory receptors. PBNK cells from healthy donors (HD) and ccRCC patients (P) were analyzed by FC to compare, in the CD3-CD56bright (left graph) and CD3-CD56dim cells (right graph) subsets, the frequency of cells that expressed CD16 (A), the intensity of expression of DNAM-1 (B), NKG2D (C), NKp30 (D), NKp46 (E), NKp80 (F), the frequency of cells that expressed CD48 (G), and the intensity of expression of CD48 (H). Also, we analyzed the frequency of CD85j+ cells (left graph) and the intensity of expression of CD85j (right graph) in CD3-CD56dim cells (I). In addition, in CD3-CD56bright (left graph) and CD3-CD56dim cells (right graph) we analyzed the intensity of expression of CD45 (J), the frequency of PD-1+ cells (K), and the intensity of expression of MHC-I (L). For HD: n=13 (A–F, J), n=11 (G, H), n=10 (I, L) and n=6 (K). For P: n=12 (A–C, E, J), n=1 (D, F, I), n=9 (G, H), n=5 (K) and n=6 (L). A two-sided unpaired t-test with Welch´s correction was used in left graphs of (A–C, G, H), in both graphs of (D–F), and in right graph of (I) A two-sided unpaired t-test with Mann-Whitney´s correction was used in right graphs of (A–C, G, H), in left graph of (I) and in both graphs of (J–L). ns, not significant; *p < 0.05; **p < 0.01; ***p < 0.001; ****p < 0.0001.

