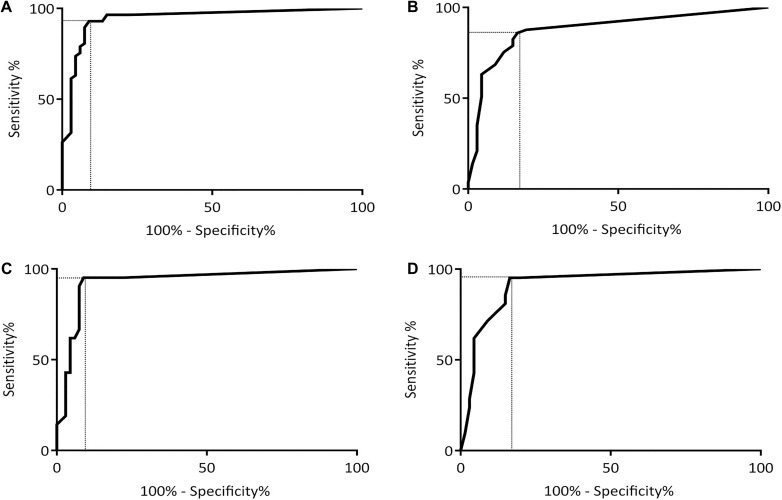
FIGURE 2.
ROC curves for the DUDIT and the DUDIT-C with sensitivity plotted against 100%-specificity. Dotted lines mark levels of sensitivity and 100%-specificity that are in line with optimal cut-off score based on Youden’s Index J. (A) ROC curve for the DUDIT in the complete sample. (B) ROC curve for the DUDIT in the sample of mild and moderate cases. (C) ROC curve for the DUDIT-C in the complete sample. (D) ROC curve for the DUDIT-C in the sample of mild and moderate cases.

