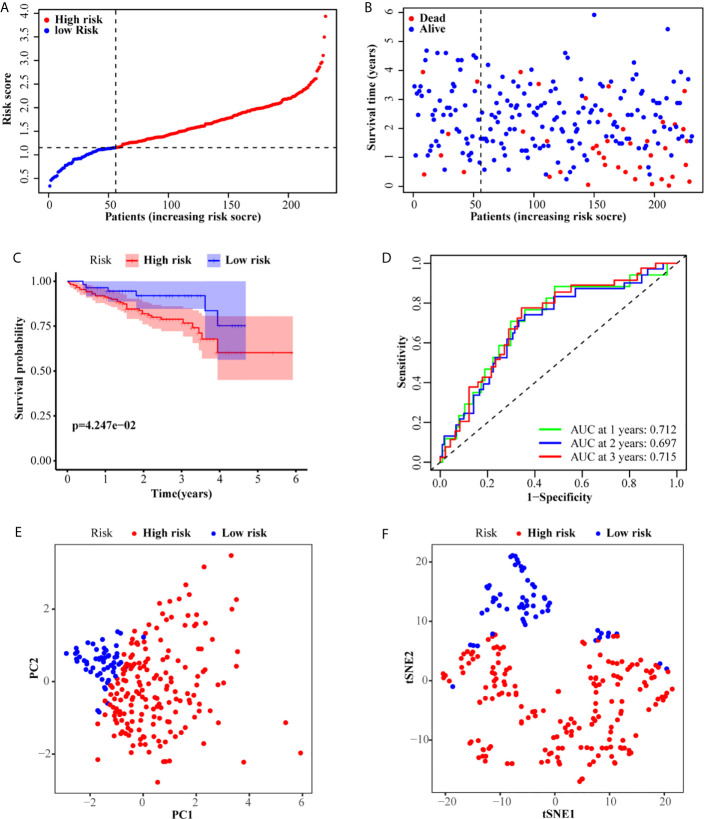
Figure 3.
Validation of the six-gene signature in the ICGC set. (A, B) The distribution and median value of the risk scores in the ICGC set. (C) Kaplan–Meier curves for the OS of patients in the high-risk group and low-risk group. (D) AUC of time-dependent ROC curves in the ICGC set. (E) PCA and (F) t-SNE analysis of the ICGC set.

