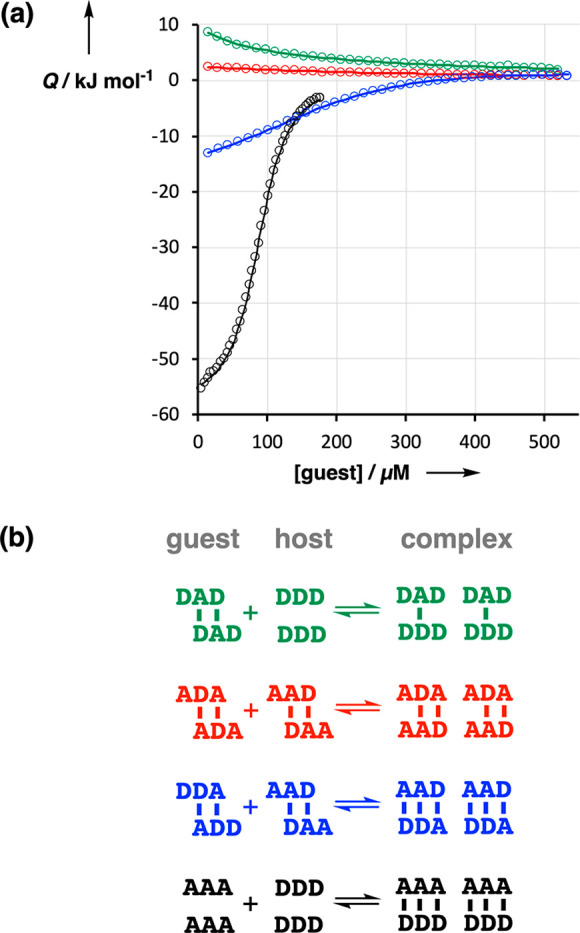
Figure 8.

(a) Isothermal titration calorimetry data (circles) for titration of DAD into DDD (green), ADA into AAD (red), ADD into AAD (blue), and AAA into DDD (black). The lines represent the best fits to an isotherm that allows for formation of a 1:1 complex as well as dimerization of the two components. (b) Structures of the duplexes formed by self-association of the guest and the host used in the ITC experiments, and the structures of the duplexes formed in the mixture (color coding as in panel a).
