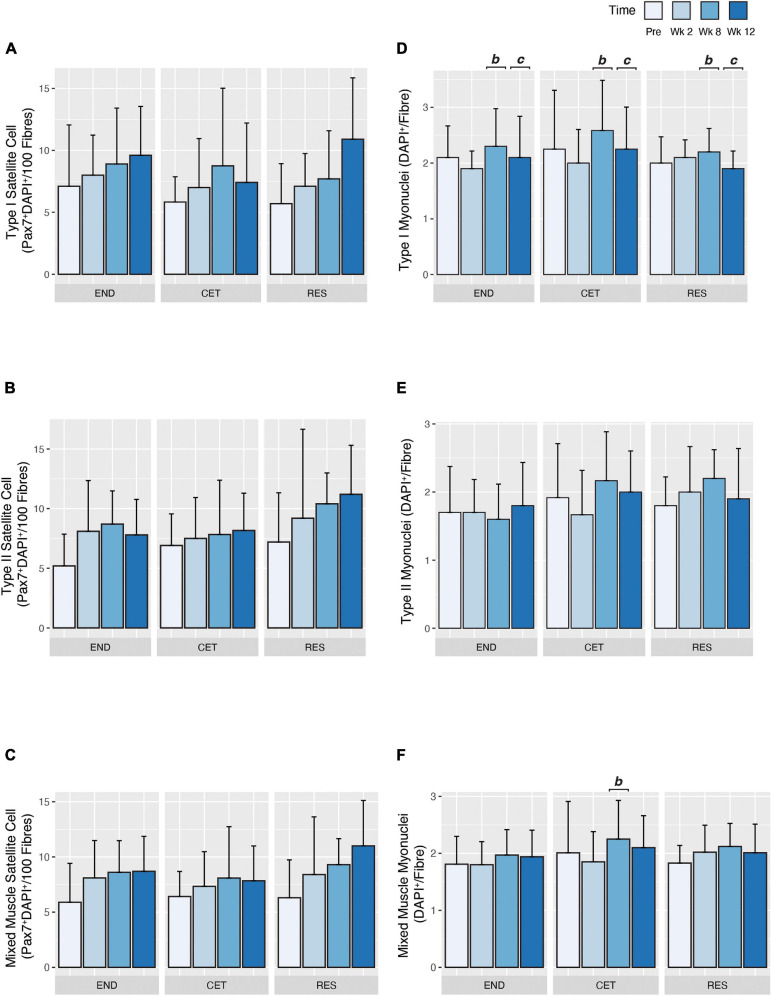
FIGURE 5.
Fibre type-specific satellite cell (A–C) and myonuclear (D–F) expansion in response to endurance (END, n = 10), resistance (RES; n = 10), or concurrent (CET; n = 12) training. Change in myosin heavy chain type I (A), myosin heavy chain type II (B), and mixed (C) myofibre satellite cell content. Change in myosin heavy chain type I (D), myosin heavy chain type II (E), and mixed (F) myofibre myonuclear content. b, significantly different from week 2 time point (P < 0.05); c, significantly different from week 8 time point (P < 0.05). Values are presented as Mean ± SD.

