Figure 2.

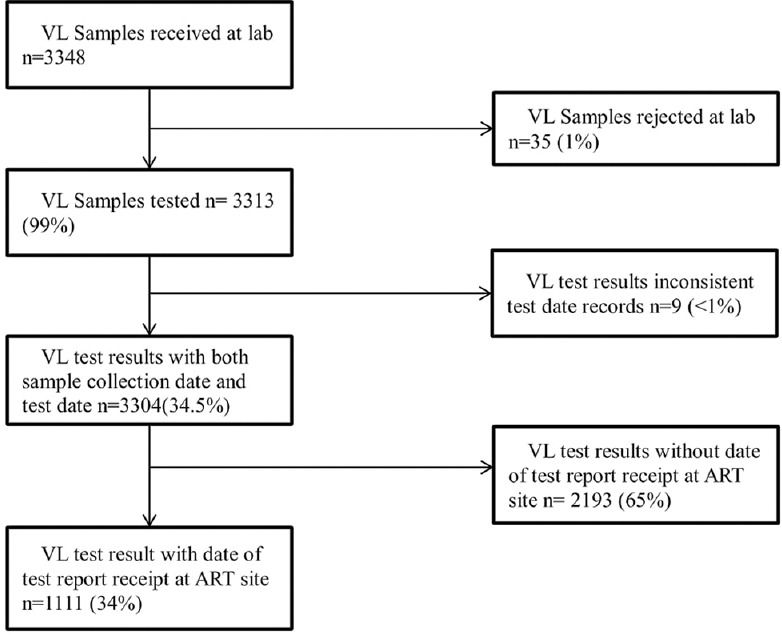
Flow chart of viral load samples tested and result sent to the referring health facility in Marondera, Zimbabwe, between January and September 2018

Flow chart of viral load samples tested and result sent to the referring health facility in Marondera, Zimbabwe, between January and September 2018