Figure 1.
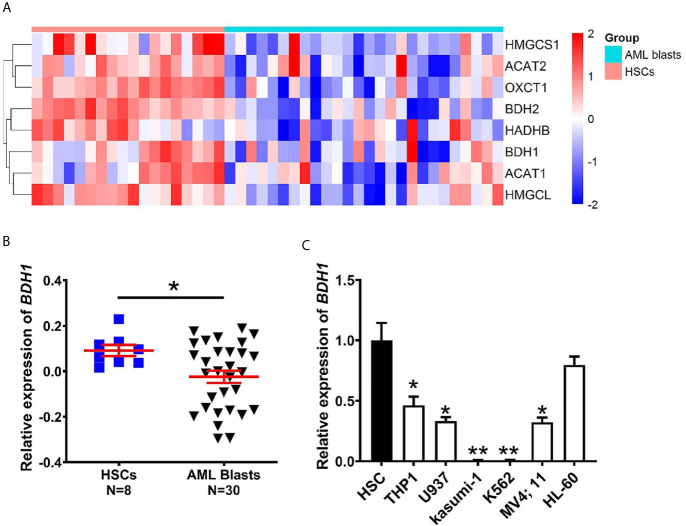
The expression of BDH1 is downregulated in AML as compared with normal HSCs. (A) A heatmap of the hierarchical clustering of 8 key genes involved in ketone body metabolism. Input data are the mRNA expression values of AML blasts over normal HSCs. Upregulated genes are designated with red color, while blue color indicates downregulated genes. (B) The mRNA expression analysis of BDH1 in 30 cases of AML blasts and 8 cases of normal HSCs in GSE65409 database. The expression values in GSE65409 were log2-transformed and mean centered. The P values were detected by t-test. (C) The expression level of BDH1 was determined by qRT-PCR in AML cell lines and normal HSCs, normalized to GAPDH. *p < 0.05, **p < 0.01.

