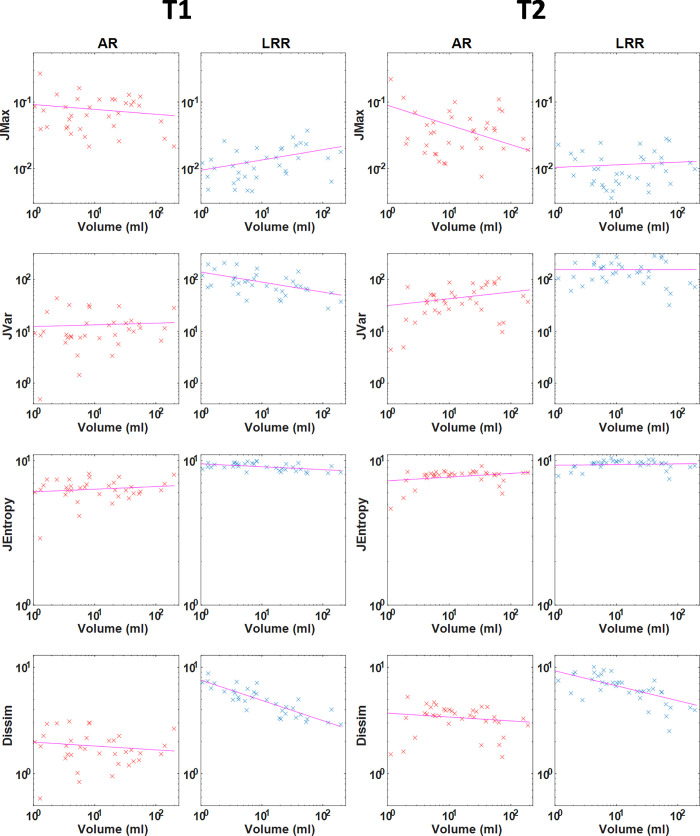
Fig 5. Pairwise scatter plots of four calculated texture parameters with the lesion volumes including all tumor VOIs employing a bin width of 50 (AR method) and a bin number of 64 (LRR method).
The four TIs shown here are GLCM-based parameters: JMax, Jvar, JEntropy and Dissim. The subplots are organized in a 4column way, where the two columns on the left and right refer to the T1- and T2-weighted images. The scatter plots have a logarithmic scale on both axes.

