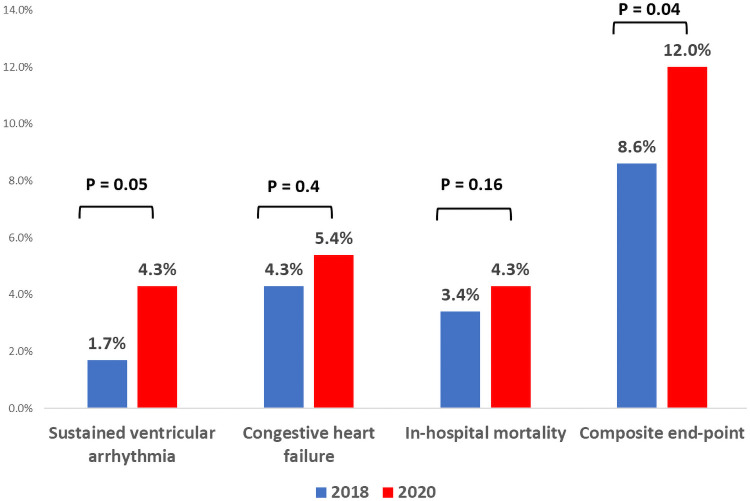
Fig 5. Distribution of primary end-point and its individual components according to the hospitalization period.
Red bars represent patients admitted with STEMI during the Covid-19 era and blue bars represent patients admitted with STEMI during the corresponding control period in 2018. *Multivariable logistic regression model further adjusted for elderly patients (> 65 years), diabetes mellitus, hypertension, dyslipidemia, smoking status, prior coronary artery disease and chronic renal failure.

