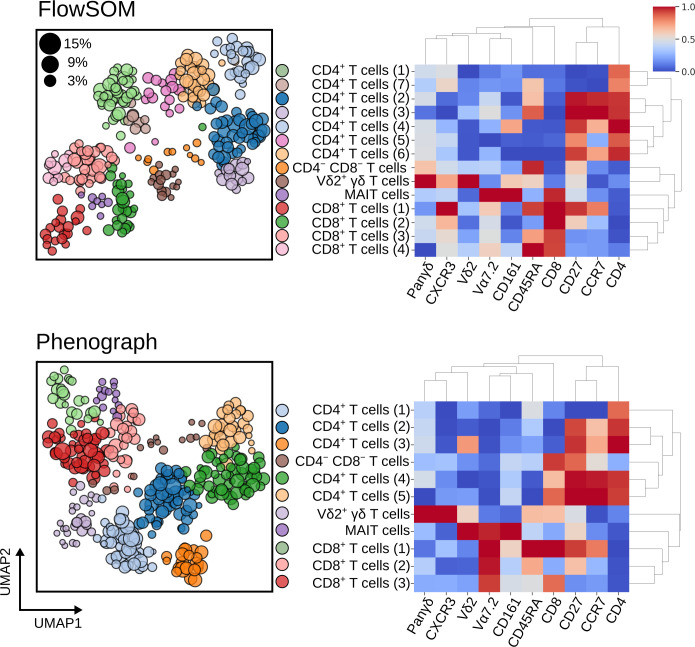
Fig 6.
Meta-clustering results for FlowSOM (top) and Phenograph (bottom) when applied to blood T cells after batch effect correction with Harmony. Heatmaps show the normalised expression of cell surface markers for meta-clusters (clustered centroids of individually clustered patient samples). In the neighbouring UMAP plots, clusters from all patients are shown in the same embedded space and coloured by their meta-cluster membership. The size of each data point corresponds to the percentage of T cells this cluster represents in the patient it was derived from.

