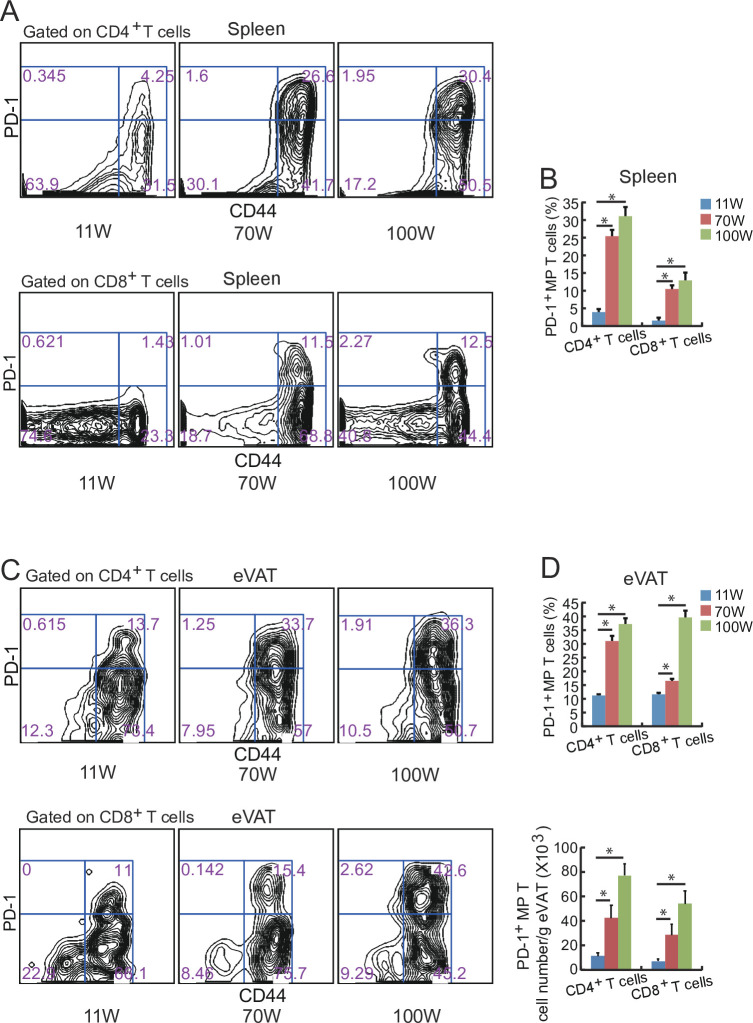
Fig 3. The increase in the PD-1+ T-cell subpopulation is associated with advanced age.
(A, B) Flow cytometric analysis of PD-1+ CD44+ CD4+ T cells and PD-1+ CD44+ CD8+ T cells in spleen cells of WT mice of different ages fed with a ND (n = 5–6 mice in each group). (C, D) Flow cytometric analysis of PD-1+ CD44+ CD4+ T cells and PD-1+ CD44+ CD8+ T cells from the stromal vascular fraction (SVF) from the eVAT of WT mice of different age fed an ND. (n = 5–6 mice in each group). *P < 0.05; NS: not significant. Data are represented as the mean ± SEM.

