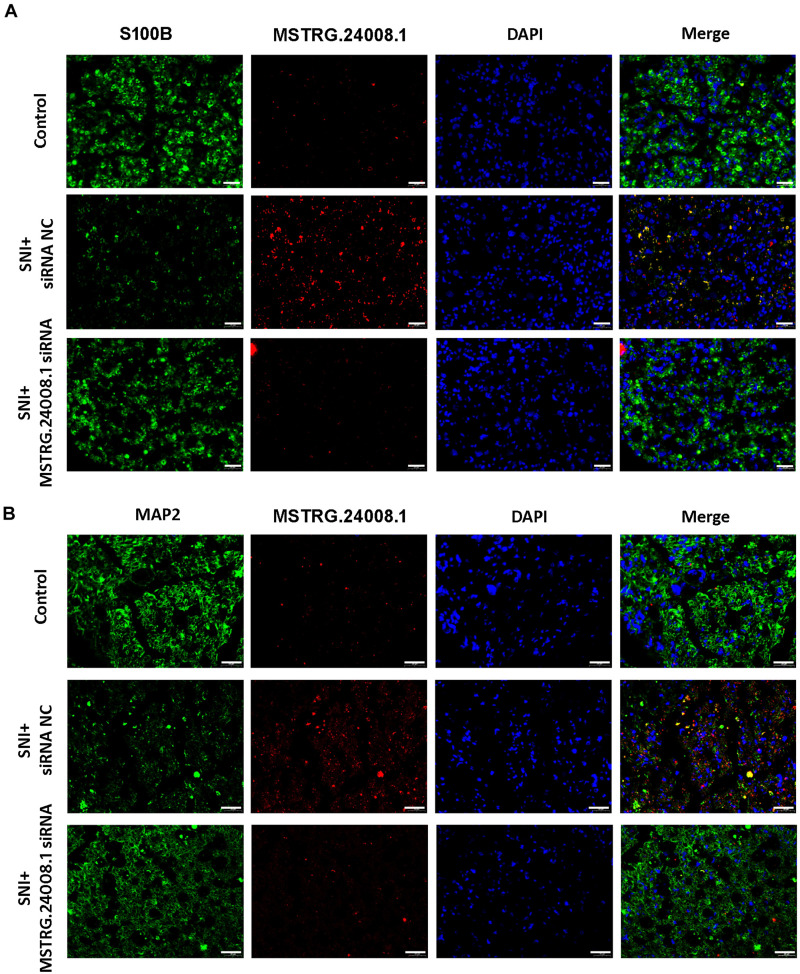
FIGURE 4.
The expression levels of S100B and MAP2 detected in SNI using fluorescence in situ hybridization. (A) Fluorescence in situ hybridization indicated that the expression of MSTRG.24008.1 was significantly increased and that of S100B was significantly decreased in the SNI group compared with those in the Sham group; however, the expression of MSTRG.24008.1 was significantly decreased and that of S100B was significantly increased in the SNI group treated with the MSTRG.24008.1 siRNA compared with those in the SNI group. (B) Fluorescence in situ hybridization indicated that the expression of MSTRG.24008.1 was increased, and that of MAP2 was significantly decreased in the SNI group compared with those in the Sham group; however, the expression of MSTRG.24008.1 was significantly decreased and that of MAP2 was significantly increased in the SNI group treated with the MSTRG.24008.1 siRNA compared with those in the SNI group. Scale bar: 20 μm (A,B).

