
Fig. 2. Dysregulated expression of Gal1 and specific glycosyltransferases in IBD.
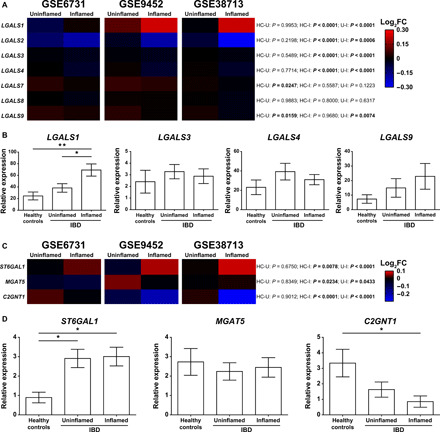
(A) Bioinformatic analysis of galectin expression (LGALS1, LGALS2, LGALS3, LGALS4, LGALS7, LGALS8, and LGALS9) in IBD datasets. (B) Expression of LGALS1, LGALS3, LGALS4, and LGALS9 analyzed by RT-qPCR in colon biopsies from healthy controls (n = 8), uninflamed (n = 13), and inflamed (n = 11) areas from colon biopsies of a local cohort of patients with IBD. (C) Bioinformatic analysis of glycosyltransferases relevant for Gal1 binding (ST6GAL1, MGAT5, and C2GNT1) in IBD datasets. (D) Expression of ST6GAL1, MGAT5, and C2GNT1 analyzed by RT-qPCR in colon biopsies from healthy controls (n = 6), uninflamed (n = 15), and inflamed (n = 14) areas from colon biopsies of a local cohort of patients with IBD. In (A) and (C), two-way analysis of variance (ANOVA) followed by Tukey’s posttest was used; colors in the heatmap depict the logarithm (base 2) of the fold change (log2FC), comparing uninflamed (U) and inflamed (I) areas of colon biopsies from patients with IBD with healthy controls (HC). In (B) and (D), one-way ANOVA followed by Tukey’s posttest was used. Unless otherwise stated, data are presented as means ± SEM. HC-U, healthy controls vs. uninflamed areas; HC-I, healthy controls vs. inflamed areas; U-I, uninflamed vs. inflamed areas. *P < 0.05 and **P < 0.01.