
Fig. 7. C2GnT1 and ST6Gal1 glycosyltransferases reciprocally control the development of TNBS-induced colitis.
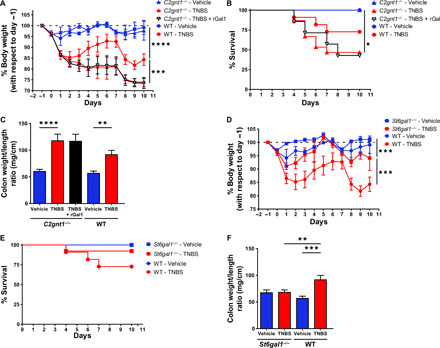
(A) Weight loss curves of WT and C2gnt1−/− mice treated with ethanol (vehicle), TNBS, or TNBS and rGal1. (B) Kaplan-Meier (survival) curves of WT and C2gnt1−/− mice with TNBS-induced colitis treated or not with rGal1. (C) Colon weight/length ratio. (D) Weight loss curves of WT and St6gal1−/− mice treated with ethanol (vehicle) or TNBS. (E) Kaplan-Meier (survival) curves of WT and St6gal1−/− mice with TNBS-induced colitis. (F) Colon weight/length ratio. Experiments described in this figure were performed simultaneously, so values for WT mice are identical and only included in separate panels for the sake of clarity. In (A) and (D), data are from a representative of two independent experiments (n = 5 mice per group); two-way repeated-measures ANOVA followed by Tukey’s post-test. In (B) and (E), data are presented as mean survival proportions from a representative of two independent experiments (n = 7 mice per group); Mantel-Cox (log-rank) test. In (C) and (F), data are from a representative of two independent experiments (n = 5 mice per group); two-way ANOVA followed by Tukey’s posttest. Unless otherwise stated, data are presented as means ± SEM. *P < 0.05, **P < 0.01, ***P < 0.001, and ****P < 0.0001.