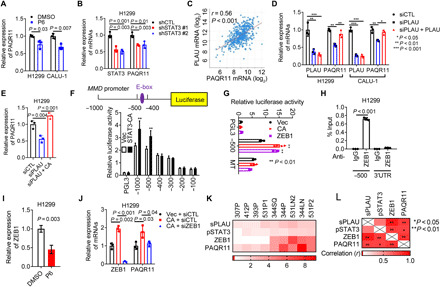
Fig. 6. Autocrine PLAUR activation regulates PAQR11 expression.

(A and B) qPCR analysis of cells treated for 2 days with 1 μM JAK inhibitor (P6) (A) and in shSTAT3-transfected cells (B). (C) Pearson correlation between PLAU and PAQR11 mRNAs in TCGA LUAD cohort. (D and E) qPCR analysis of siPLAU-transfected cells treated for 2 days with recombinant PLAU (10 ng/ml) (D) and in cells cotransfected with siPLAU and empty vector (Vec) or constitutively active mutant STAT3 (STAT3-CA) (E). (F) MMD gene promoter (schema). Luciferase assays on H1299 cells cotransfected with MMD promoter constructs and STAT3-CA or Vec. Empty reporter (pGL3). (G) Luciferase assay on H1299 cells cotransfected with wild-type (−500) or E-box–mutated MMD promoter and indicated expression vectors. (H) Chromatin immunoprecipitation assays on the MMD promoter (−500) using immunoglobulin G (IgG) or anti-ZEB1 antibodies. PAQR11 3′UTR (negative control). (I and J) qPCR analysis of H1299 cells treated for 2 days with 1 μM P6 (I) or cotransfected with STAT3-CA or Vec and siZEB1 or siCTL (J). (K) Heatmap depiction of ZEB1 and PAQR11 mRNA levels; pSTAT3/total STAT3 ratio; and secreted PLAU levels (sPLAU) in murine LUAD cell line panel. (L) Heatmap depiction of Pearson correlation (R values) of results in (K). Results represent means ± SD values from a single experiment incorporating biological replicate samples (n = 3, unless otherwise indicated) and are representative of at least two independent experiments. P values, two-tailed Student’s t test (two-group comparisons) and one-way ANOVA test (multiple comparisons).
