
Fig. 2. Structural and energetic changes of the Asp410-Arg381 salt bridge.
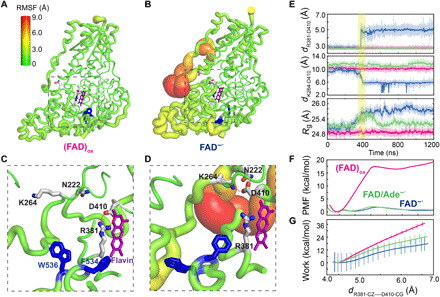
Sausage representation of the computed RMSFs of the backbone atoms in the (FAD)ox (A) and FAD−● (B) states. The RMSF values are encoded by both the thickness and color in the illustration. Close-up view of hydrogen bonding interactions of Asp410 (D410) in (C) the (FAD)ox state with Arg381 (R381) and in (D) the FAD−● state with Lys264 (K264) and Asn222 (N222). (E) Time evolution of the distance between Asp410 and Arg381, distance between Asp410 and Lys264, and gyration of radius (Rg) over all backbone CA atoms in the oxidized (FAD)ox (magenta), FAD−● (blue), and FAD/Ade−● (green) states. The shaded area in yellow indicates concerted motions between the disruption of the Asp410-Arg381 salt bridge and the formation of the Asp410-Lys264 contact, accompanied by an increase in Rg in the FAD─● state (blue). (F) Computed potential of mean force (PMF) as a function of the ion-pair separation between Asp410 and Arg381 from umbrella sampling simulations at different cofactor states: oxidized (FAD)ox (magenta), FAD−● (blue), and FAD/Ade−● (green). (G) Computed average nonequilibrium work for separating the Asp410-Arg381 salt bridge through steered MD simulations. The color code is the same as that in (F).