
Fig. 3. Revisitation is predicted by hippocampal theta oscillations.
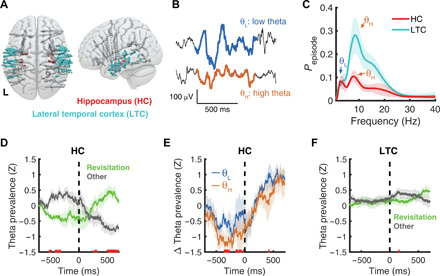
(A) Field potentials were recorded from iEEG electrodes in bilateral hippocampus (HC; red) and in a control region (LTC; cyan). (B) Example low- and high-frequency theta oscillations recording from the hippocampus. (C) Oscillation detection revealed prevalent low- and high-frequency theta oscillations within the hippocampus and LTC. (D) In hippocampus, theta prevalence differed significantly [P < 0.05, false discovery rate (FDR)–corrected] preceding (~500 to 300 ms) and following (~500 to 700 ms) revisitation fixations (time = 0 indicates fixation onset). (E) This relationship was more robust for higher- than lower-frequency theta oscillations. (F) Within LTC, no significant differences in theta prevalence were detected, leading up to revisitation fixations. Shaded regions denote 1 SEM across N = 6 participants.