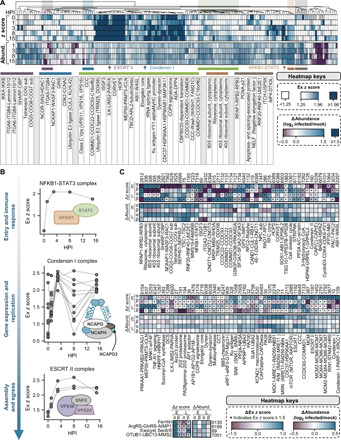
Fig. 2. CORUM complex dynamics during HSV-1 infection and a comparative analysis with HCMV infection.

(A) Hierarchical clustering of CORUM complex dynamics during HSV-1 infection. Any complex passing filtering criteria with an average Ex z score ≥ 1.5 across subunits is represented, and both Ex z scores and changes in complex abundance (relative to mock) are plotted. The table below the heatmaps shows the names of selected complexes denoted in the above heatmaps. (B) Dynamic interaction properties of NFKB1-STAT3 (top), Condensin I (middle), and ESCRT II (bottom) complexes during infection with HSV-1. For each complex, all subunits are represented, and each data point represents the Ex z score for a given pair of subunits. Gray lines connect data points for a given pair of subunits across infection time. (C) Comparison of CORUM complex dynamics during HSV-1 (this study) versus HCMV (23) infection. Heatmaps reflect the average change in complex Ex z scores (relative to the previous time point) and abundances (relative to mock) for each complex across both infections for early (HSV-1, 3 HPI; HCMV, 24 HPI) and late (HSV-1, 15 HPI; HCMV, 96 HPI) infection time points. Only complexes meeting our filtering and significance criteria for both viruses are shown.
