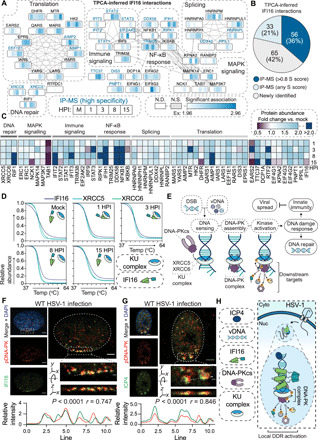
Fig. 5. IFI16 interacts with the DNA-PK complex at vDNA in the nuclear periphery.

(A) Protein interaction network of TPCA-derived IFI16 PPIs. Gray lines indicate STRING interactions, and proteins are clustered by annotation (STRING and Reactome). Heatmaps above the nodes represent significant Ex z scores for IFI16 interactions with that node at 0, 1, 3, 8, and 15 HPI time points. Proteins previously identified to associate with IFI16 by IP-MS are labeled in blue. N.S., not significant. (B) Pie chart showing the proportion of overlap with IFI16 IP-MS studies for TPCA-inferred interactions. (C) Heatmap of protein abundances over the HSV-1 infection time course relative to the uninfected control. (D) Smoothed protein aggregation curves for IFI16 (dark blue), XRCC5 (teal), and XRCC6 (green) at each time point of infection. (E) Model for the DNA-PK DDR to DSBs and vDNA. (F and G) DNA-PKcs pS2056 (red) staining for immunofluorescent microscopy (IFA) at 100× after wild-type (WT) HSV-1 infection (3 HPI) with staining (green) for either (F) IFI16 or (G) ICP4. Scale bars, 5 or 1 μm in the inset (dashed box). The dashed line in the inset represents line scans for spatial quantification of pDNA-PK versus IFI16 or pDNA-PK versus ICP4 intensities for 30 nuclei across biological replicates (n = 3). Representative images are shown. Pearson’s correlation coefficient (PCC) between pDNA-PK versus IFI16 or ICP4 is represented for the displayed line scan. (H) Model representing IFI16 association with kinase activated DNA-PK holoenzyme with ICP4-labeled vDNA in the nuclear periphery.
