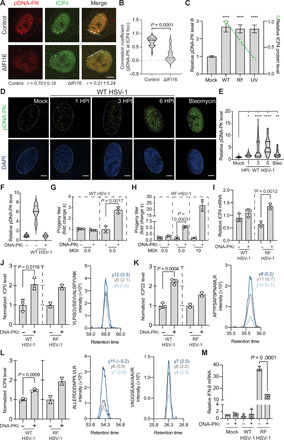
Fig. 6. DNA-PK initiates an antiviral DDR that inhibits HSV-1 replication.

(A and B) WT HSV-1–infected (3 HPI) control and ΔIFI16 HFF cells were stained for DNA-PK activation (pDNA-PK) and ICP4 expression. Colocalization (PCC) was measured at the line (20 nuclei per n; n = 2). (C) ICP4 (green line) and pDNA-PK (gray bars) levels during WT, RF, or ultraviolet (UV)–inactivated WT HSV-1 infection (1 HPI) by IFA. Shown is mean ± 95% confidence interval for 50 nuclei per n (n = 3). (D and E) Time course of DNA-PK activation (green) during WT HSV-1 infection by IFA. Scale bars, 10 μm at 60× magnification. Fifty nuclei per n (n = 4). (F) DNA-PK inhibition (DNA-PKi; NU7441 at 2 μM) efficiency was assessed by pDNA-PK staining in the dimethyl sulfoxide (DMSO) control (−) compared to DNA-PKi (+) (n = 2). (G) WT [multiplicity of infection (MOI) 0.5: n = 5; MOI 5: n = 3] or (H) RF (MOI 0.5: n = 3; MOI 5: n = 3; MOI 10: n = 2) HSV-1 titers (24 HPI) after DNA-PKi or DMSO treatment. Replicates were normalized by the replicate average. (I) ICP4 mRNA levels were quantified by qPCR (ΔΔCt against GAPDH) at 6 HPI. (J to L) (Left) Targeted MS analysis (PRM) of the HSV-1 genes (J) ICP0, (K) ICP22, and (L) ICP4 during WT (n = 3) or RF HSV-1 (n = 2) infection. (Right) The most intense peptide transitions with mass error [parts per million (ppm)]. (M) IFN-β mRNA levels as in (I). Significance was determined by analysis of variance (ANOVA) for (C) and (E) and Student’s t test for all others. Bar plots are mean ± SD and all replicates are biological. See also fig. S4. *P < 0.05, **P < 0.01, ***P < 0.001, and ****P < 0.0001.
