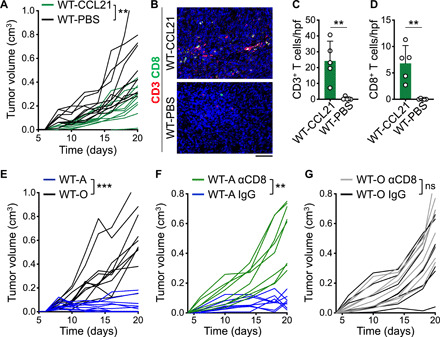
Fig. 6. CCL21 suppresses breast tumor growth through the induction of antitumor CD8+ T cell immunity in vivo.

(A) Spider plot of PyMT breast tumor growth in WT mice treated with 1 μg of CCL21 or sterile PBS (carrier only) intratumorally every other day six times starting at day 6 after PyMT cell injection (**P < 0.01 starting at day 8, n = 10 in each group). (B to D) Tumor-infiltrating CD3+ T and CD8+ T cells shown as (B) representative images of CD3- and CD8-stained tumor tissues, (C) CD3+ T cell, and (D) CD8+ T cell counts in CCL21- and PBS-treated breast tumors. Note that T cells were rarely found in PBS-treated breast tumors. n = 5 in each group. (E) Spider plots of DMBA- and DMSO-treated PyMT breast cancer cell growth in WT mice (WT-A and WT-O, respectively; ***P < 0.0001 starting at day 12; n = 10 in each group). (F) Spider plot of DMBA-treated PyMT breast tumor growth in WT mice treated with anti-CD8β versus IgG control antibody (n = 8 per group; **P < 0.01 starting at day 6). (G) Spider plot of DMSO-treated PyMT breast tumor growth in WT mice treated with anti-CD8β versus IgG control antibody (n = 8 per group). Mann-Whitney U test was used. Graphs show means + SD. Scale bar, 100 μm.
