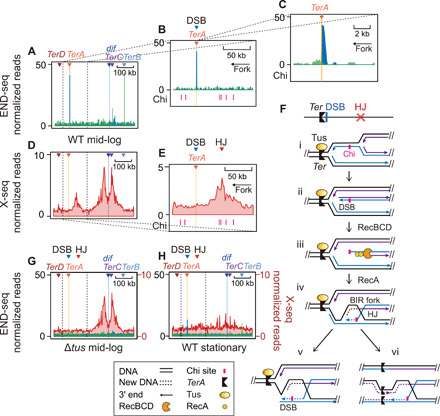
Fig. 4. Recurrent DSBs with HJs at a barrier; Tus and proliferation dependence.

(A to C) END-seq data identify a “TerA-facing” DSB-end on the replication-arresting side of the TerA barrier; Ter zoomed-in views at different scales. Blue and green represent DSB-end polarities per Fig. 3A. (D and E) X-seq data show recurrent HJs next to the TerA barrier and its recurrent DSB peak (A); Ter zoomed-in views at scales aligned with genome locations in (A) and (B) above them, respectively. (F) Model for Tus/Ter-induced one-ended DSB formation (30) and subsequent HR that generates HJs upstream of the Tus/Ter barrier and its recurrent DSB ends. Black lines, template DNA strands; solid blue lines, nascent strands from the first round of replication; solid purple lines, nascent strands from a second round of replication; arrow heads, 3′ ends; dotted blue or purple lines, nascent strands during BIR repair. (G and H) Tus and proliferation dependence of the DSB and HJ peaks right of TerA, respectively (END-seq, blue and green; X-seq, red). Ter zoomed-in views.
