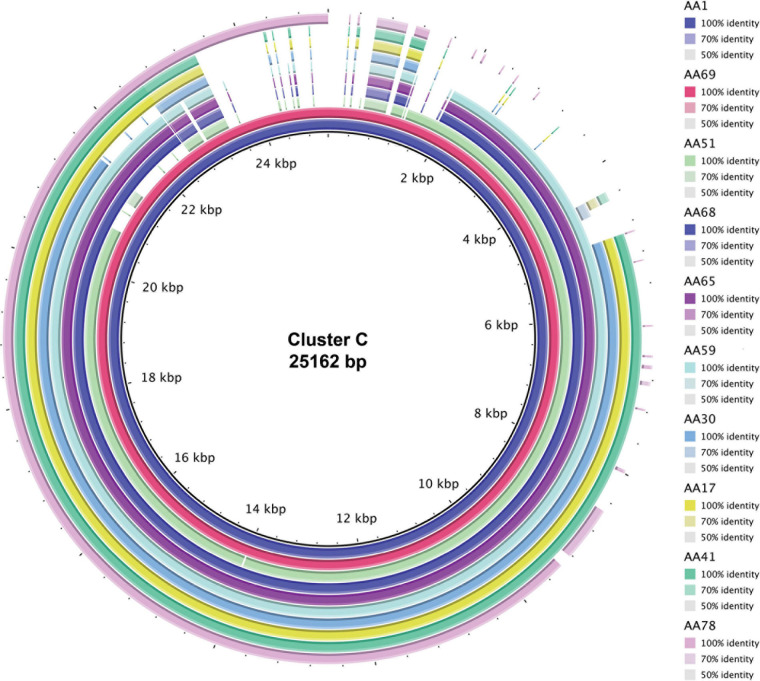
FIGURE 2.
Sequence alignment of the 10 plasmid sequences grouped into Cluster C. The legend indicates the color for the plasmid sequence with the darker tones indicating 100% sequence identity and lighter tones indicative of less sequence identity. Gaps in the alignment signify regions that are not found within the plasmid sequence. The total alignment is 25,162 bp.

