FIGURE 7.
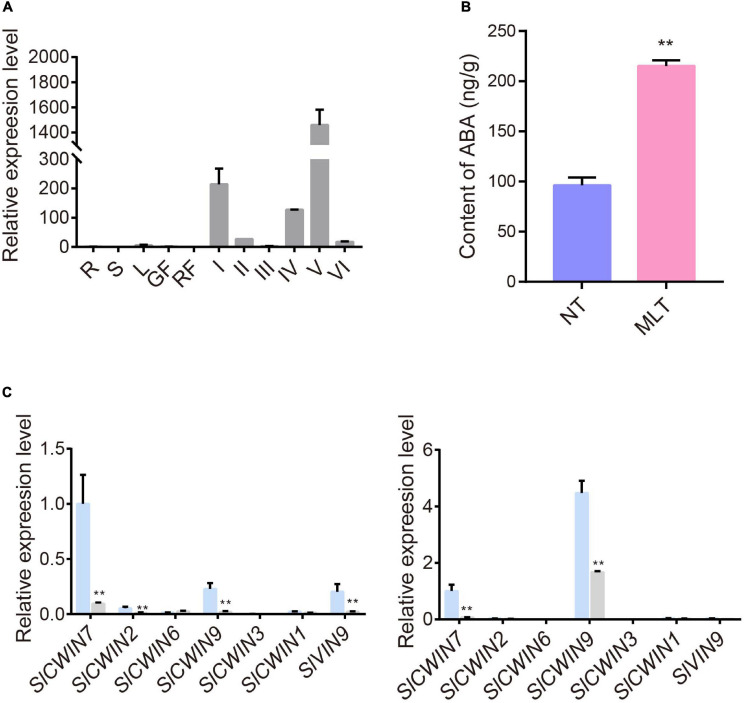
The expression profiles of SlABCG31 and ABA levels in anther under NT and MLT conditions. (A) qPCR analysis of SlABCG31 in various tissues of tomato, especially in anther at different stages. The genes expression levels normalized to Ubiquitin expression are shown relative to root set to 1. R, root; S, stem; L, leaf; GF, green fruit; RF, red fruit; I, anther at microspore mother cell stage; II, anther at tetrad stage; III, anther at early uninucleate stage; IV, anther at late uninucleate stage; V, anther at binucleate stage; VI, anther at mature pollen stage. Each value is the mean ± SD (n = at least three biological replicates with 15 plants each). (B) ABA levels in anther at stage-II under MLT-stress were increased in comparison to NT condition. Each value is the mean ± SD (n = at least three biological replicates with 15 plants each). *P < 0.05; **P < 0.01 (two-tailed Student’s t- test). (C) The expression levels of SlCWINs genes in anther at stage-II and III in NT and MLT conditions. The levels of genes expression normalized to Ubiquitin expression are shown relative to the expression of SlCWIN7 in NT condition set to 1. Each value is the mean ± SD (n = at least three biological replicates with 15 plants each). *P < 0.05; **P < 0.01 (two-tailed Student’s t- test).

