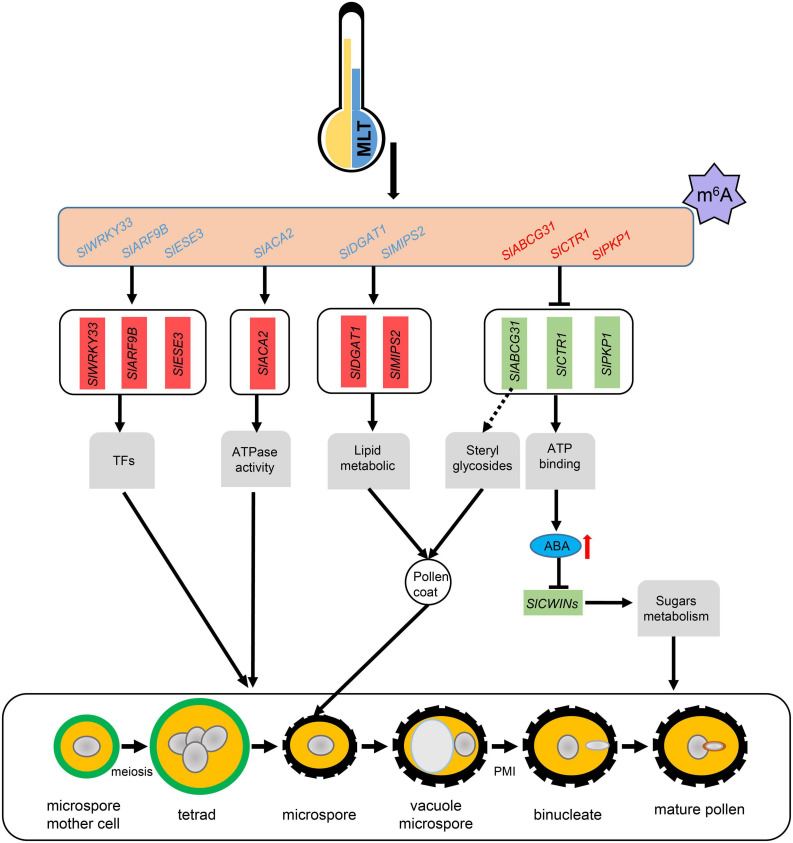
FIGURE 8.
A working model for m6A methylation affects pollen development under MLT-stress. MLT, moderate low temperature; TFs, transcript factors; Blue letters means transcripts with lower m6A levels, and red letters means transcripts with higher m6A levels; Red and green boxes represent unregulated and downregulated genes expression levels, respectively; Red arrow, significant increase.

