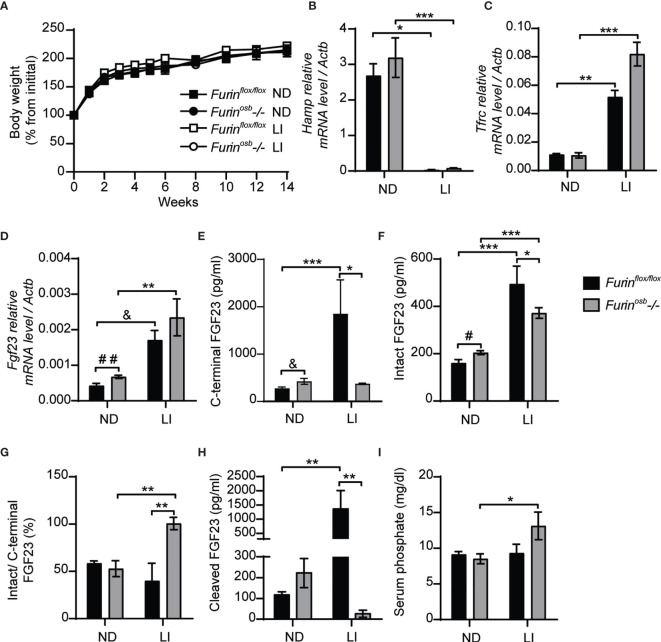
Figure 2.
Impaired FGF23 processing in Furinosb-/- mice following iron restriction. Furinflox/flox (n=3-5) and Furinosb-/- (n=7-8) 21-day-old mice were fed normal chow diet (ND) or a low iron diet (LI) for 14 weeks. (A) Body weight growth curve presented as percentage of initial body weight. (B, C) Expression of iron-regulated genes in liver. Hepcidin (Hamp) expression (B). Transferrin receptor (Tfrc) expression (C). (D) Fgf23 expression in long bone. (E–H) Plasma level of C-terminal FGF23 (E), intact FGF23 (F), percentage (%) of intact over C-terminal FGF23 (G) and cleaved FGF23 levels (H), calculated as (C-terminal FGF23) - (intact FGF23). (I) Serum phosphate levels. Results represent the mean ± SEM. *P < 0.05, **P < 0.01, and ***P < 0.001, by 2-way ANOVA with Bonferroni’s multiple comparisons test or by Student’s t-test (D–F) #: P<0.05; ##: P<0.01; &: 0.05<P<0.1.

