. 2021 Jun 18;10:e68662. doi: 10.7554/eLife.68662

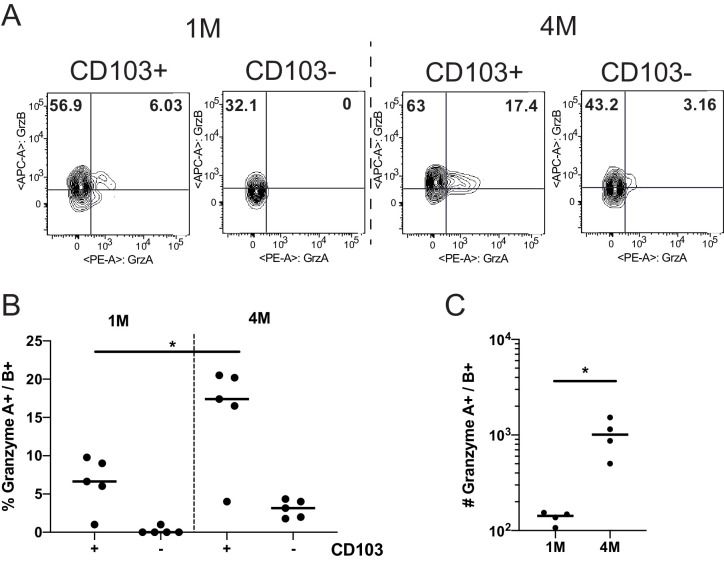
Figure 4. Repeated antigen stimulation increases granzyme production of LN Trms.

Mice were seeded with 104 naive or 105 3M P14 cells and IN infected with PR8-GP33 virus. At >60 days post-infection, mLNs were harvested, stimulated with cognate (GP33) peptide in the presence of BFA for 5 hr, and ICS was performed to evaluate the frequency of GrzA+ and GrzB+ fractions of IV CD103 or CD103+ 1M or 4M by flow cytometry. Representative flow plots (A), cumulative frequencies (B), and total numbers per mLN (C) are shown. Representative of two independent experiments, n = 4–5 mice/group. Error bars represent mean ± SD. *p<0.05, one-way ANOVA in (B), *p<0.05, Students t-test in (C).

Figure 4—source data 1. Source data for Figure 4B.
Figure 4—source data 2. Source data for Figure 4C.

Figure 4.

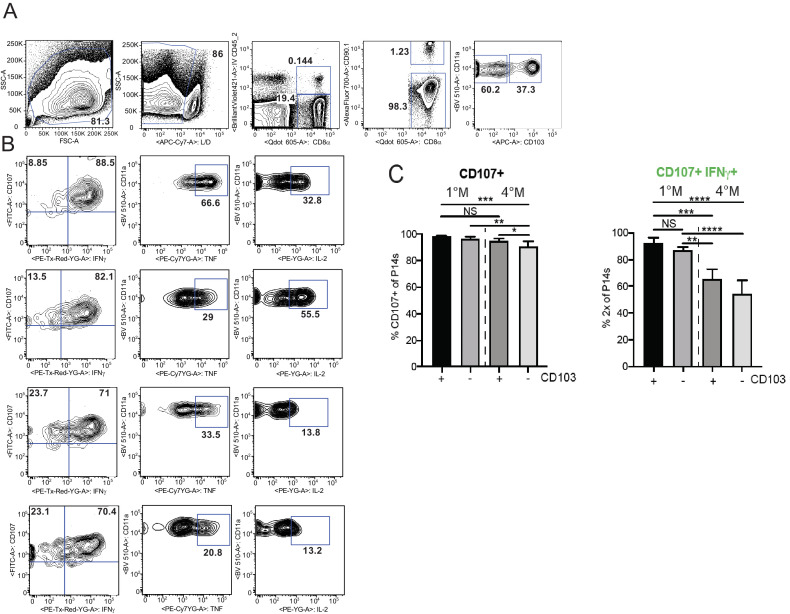
Figure 4—figure supplement 1. Repeated influenza stimulation reduces cytokine production, but does not affect degranulation capacity of LN Trm cells.

Figure 4—figure supplement 1.

Mice were seeded with 104naive P14 or 105 3M P14 cells and IN infected with PR8-GP33 virus. At 60 days post-infection, mLN and spleen were harvested and cells analyzed for peptide-stimulated cytokine production and degranulation. (A) Gating strategy for analysis of IV P14s. Single-cell suspensions were stimulated with cognate peptide (GP33) in the presence of BFA for 5 hr and ICS was performed to evaluate the frequency of CD107+, IFNγ+, TNF+, and IL-2+ fractions of IV CD103 or CD103+ 1M or 4M by flow cytometry. Representative flow plots of IFNg, TNF, and IL-2 (B), cumulative bar graphs denoting frequencies of CD107+ (C, left) and CD107+ IFNg+ (C, right) are displayed. Representative of two independent experiments, n = 4–5 mice/group. NS = not significant, *p<0.05, **p<0.01, ***p<0.001, ****p<0.0001; two-way ANOVA with Sidak’s multiple comparison test.
Figure 4—figure supplement 1—source data 1. Source data for Figure 4—figure supplement 1C.
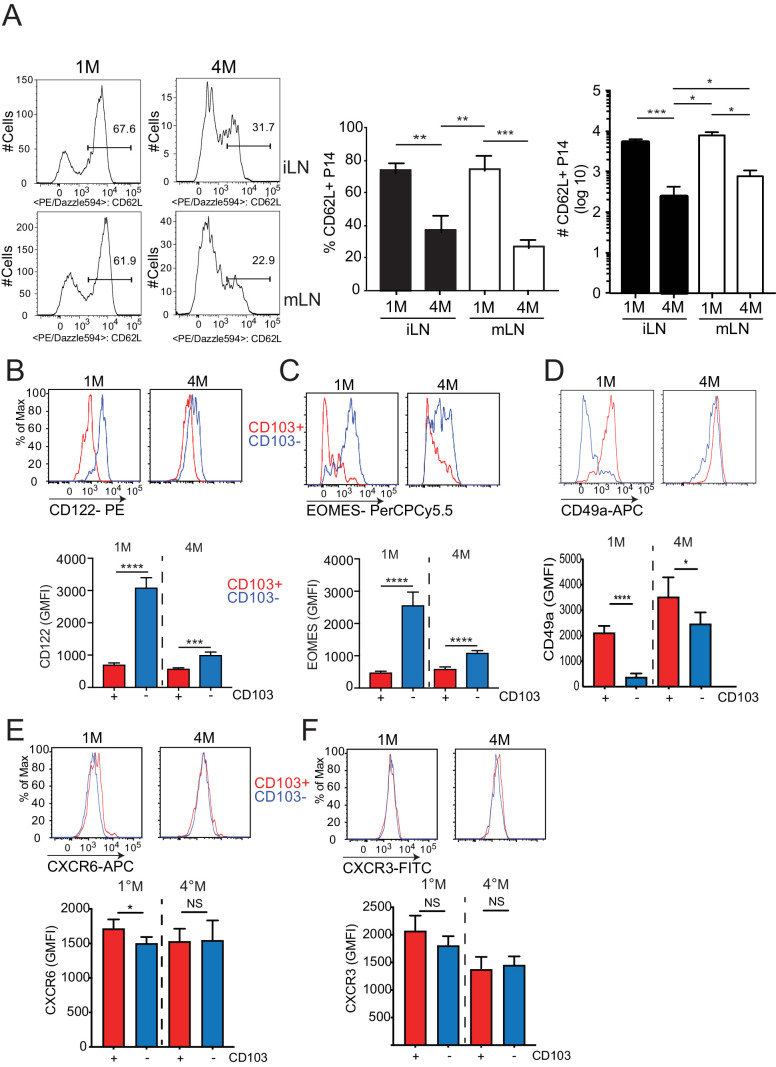
Figure 4—figure supplement 2. Repeated antigen stimulation alters the phenotype of LN Trm cells.

Figure 4—figure supplement 2.

Mice were seeded with 104naive P14 or 105 3M P14 cells and IN infected with PR8-GP33 virus. At >90 days post-infection, iLN (top) and mLN (bottom) were harvested and the frequency of 1M and 4M P14 cells evaluated. (A) Representative data examining CD62L expression; cumulative frequency data (middle); cumulative total number data (right). Representative of three independent experiments, n = 4 mice/group. Error bars represent mean ± SD. ***p<0.001, ****p<0.0001 one-way ANOVA. At >75 days post-infection, mLN were harvested from 1M and 4M mice and the relative expressions of CD122 (B), Eomes (C), CD49a (D), CXCR6 (E), and CXCR3 (F) by CD103+ (red) or CD103 (blue) P14s were evaluated. Representative histograms (top) and cumulative data (bottom) are displayed. Representative of three independent experiments, n = 4–5 mice/group. Error bars represent mean ± SD. NS = not significant, *p<0.05, ****p<0.0001, one-way ANOVA.
Figure 4—figure supplement 2—source data 1. Source data for Figure 4—figure supplement 2A.
Figure 4—figure supplement 2—source data 2. Source data for Figure 4—figure supplement 2B.
Figure 4—figure supplement 2—source data 3. Source data for Figure 4—figure supplement 2C.
Figure 4—figure supplement 2—source data 4. Source data for Figure 4—figure supplement 2D.
Figure 4—figure supplement 2—source data 5. Source data for Figure 4—figure supplement 2E.
Figure 4—figure supplement 2—source data 6. Source data for Figure 4—figure supplement 2F.