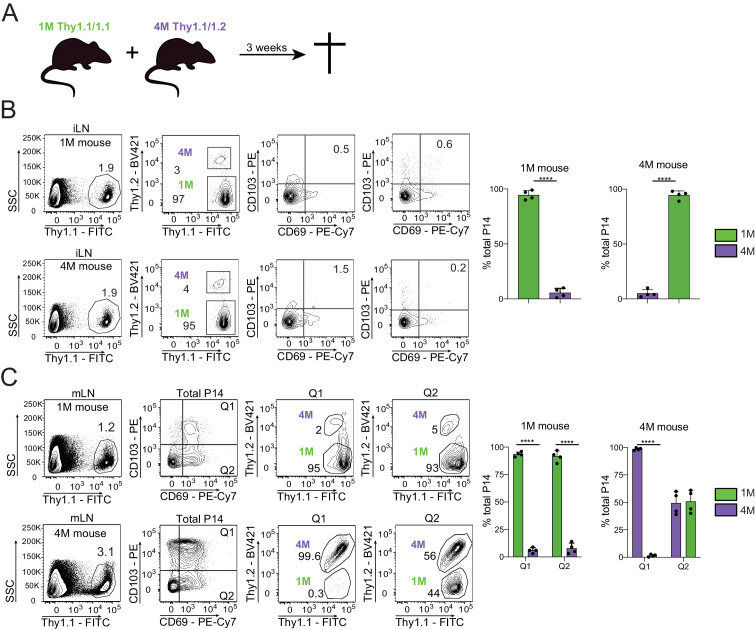
Figure 6. Residential nature of 1M and 4M LN Trm cells primed by influenza infection.
(A) 90 days after IN PR8-GP33 infection, mice bearing Thy1.1/1.1 1M P14 (green; 1M mice seeded with 104 naive P14) cells were joined by parabiotic surgery with mice bearing Thy1.1/1.2 4M P14 (purple, 4M mice seeded with 105 3M P14). Three weeks later parabionts were analyzed. (B) Abundance of 1M (green) and 4M (purple) P14 cells in iLNs of 1M (top row) and 4M (bottom row) parabiotic mice. Representative plots (left), cumulative data (right). Representative of two independent experiments, n = 4 parabionts/experiment. Error bars represent mean ± SD. ****p<0.0001, t-test. (C) Abundance and distribution of 1M (green) and 4M (purple) Trm P14 cells expressed as a % of the total Trm population (CD69+/CD103+) in mLN of 1M (top row) and 4M (bottom row) parabiotic mice. Representative plots (left), cumulative data (right). Representative of two independent experiments, n = 4 parabionts/experiment. Error bars represent mean ± SD. Two-way ANOVA with Sidak’s multiple comparison test. Q1(1M) vs Q1(4M) ****p<0.0001; Q2(1M) vs Q2(4M) ****p<0.0001; Q1(1M) vs Q1(4M) ****p<0.0001.

