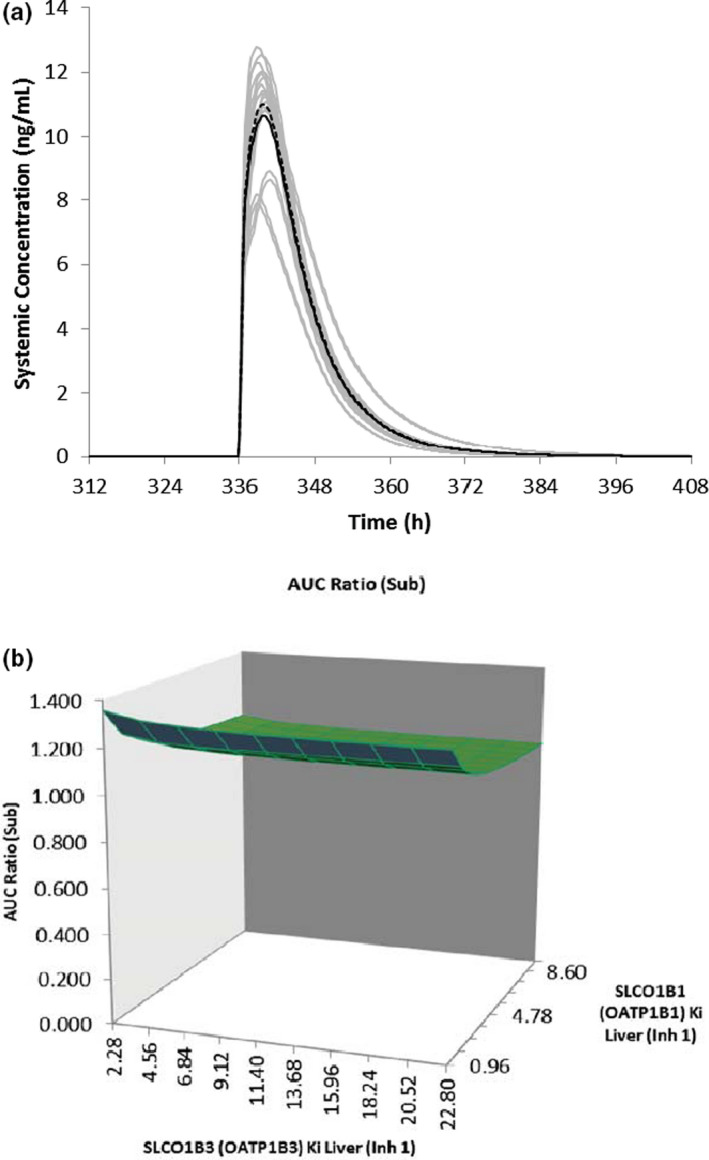
FIGURE 5.

(a) Simulated mean plasma concentration‐time profiles of rosuvastatin after a single oral dose of 20 mg in the presence (dashed line) and absence (solid line) of multiple daily doses of ivosidenib (500 mg q.d. for 19 days). The gray lines represent the outcomes of simulated individual trials (10 × 10) and the solid/dashed black line is the mean data for the simulated population (n = 100). (b) Sensitivity analysis of ivosidenib OATP1B1/1B3 Ki on the predicted rosuvastatin area under the curve ratio (AUCR)
