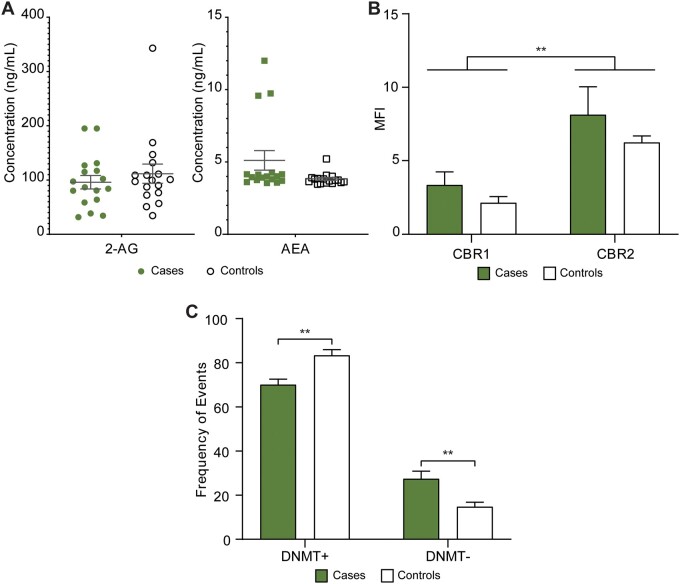
Figure 2.
Measuring the impact cannabis consumption has on the endocannabinoid system and on epigenetic machinery in vivo. (A) Concentration of endocannabinoids in FF from cases (samples that were positive for at least one phytocannabinoid) and matched controls (samples that were negative for at all phytocannabinoids) (n = 17 pairs), (B) median fluorescence intensity (MFI) of cannabinoid receptor 1 (CBR1) and 2 (CBR2) on the cell surface of granulosa cells from cases (n = 8) and matched controls (n = 6), (C) frequency of events either positive (DNMT+) or negative (DNMT−) for DNMT3b expression in granulosa cells from cases (n = 8) and matched controls (n = 6). Error bars depict standard error. Significance was determined using two-way ANOVA with Bonferroni's multiple comparisons test, **P < 0.01. FF, follicular fluid.

