Figure 5.
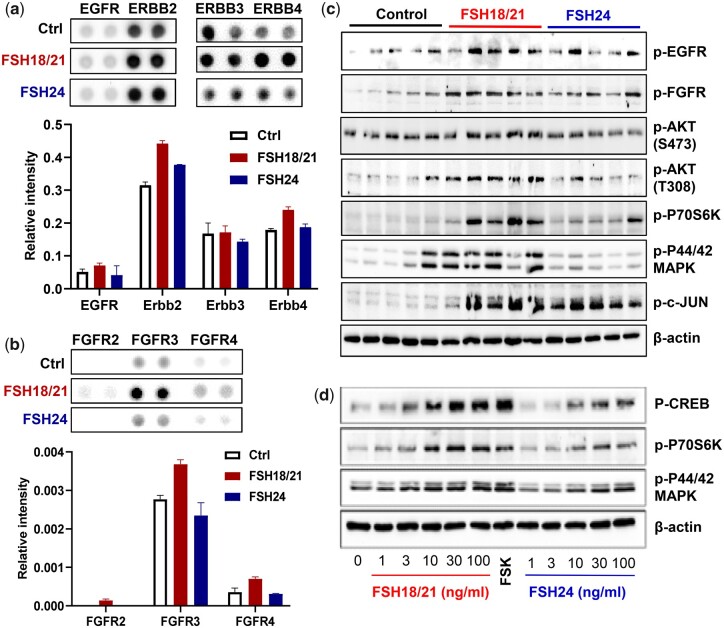
Screening of hypo- and fully-glycosylated human recombinant FSH (hFSH) crosstalk with receptor tyrosine kinase (RTK) signaling and downstream signaling pathways. PND 17 mice (n = 5) were treated i.p. with PBS (Ctrl), or 1 µg of either FSH18/21 or FSH24 for 2 hrs. Ovaries were isolated and total proteins were prepared. (a) Total protein pool from each group (n = 5) was used to perform the RTK assay. Selected image of Mouse RTK array showing the differentially activated EGFR signaling responding to the different FSH glycoform treatments (upper panel). Quantification data showing the relative phosphorylation levels of various EGFR family members (lower panel). (b) Selected image of the RTK array (upper panel) and quantification data (lower panel) showing the differential activation levels of the FGFR family. The immunosignal intensity was normalized to the control spot on each array. Each bar represents the mean immunosignal intensity ± SEM of duplicates of each RTK. (c) Protein extracts from one ovary from each mouse was prepared for Western blot analysis. The image shows the activation of RTKs and downstream pathways. (d) Human granulosa cells were treated with increasing concentrations of either FSH18/21 or FSH24 for 30 min. Western blot image showing the activation of pathways in human primary granulosa cells. Forskolin (FSK, 10 µM) was used as positive control.

