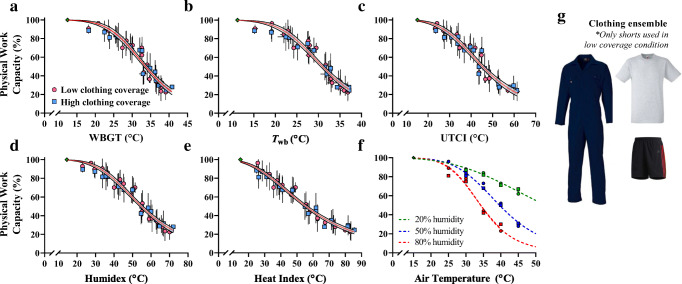
Fig. 2.
Models for the reduction in physical work capacity during heat stress. Models are presented against five heat stress indices (a-e) and for air temperature and relative humidity (f). The data used to form projections are taken as the average physical work capacity from each air temperature and humidity combination, pooling that of low- (pink circles) and high- (blue squares) clothing coverage trials (displayed in panel g). Model f was the highest performing overall, but model e (heat index) was the highest performing among different heat stress indices. Model analytics are available in Table 3

