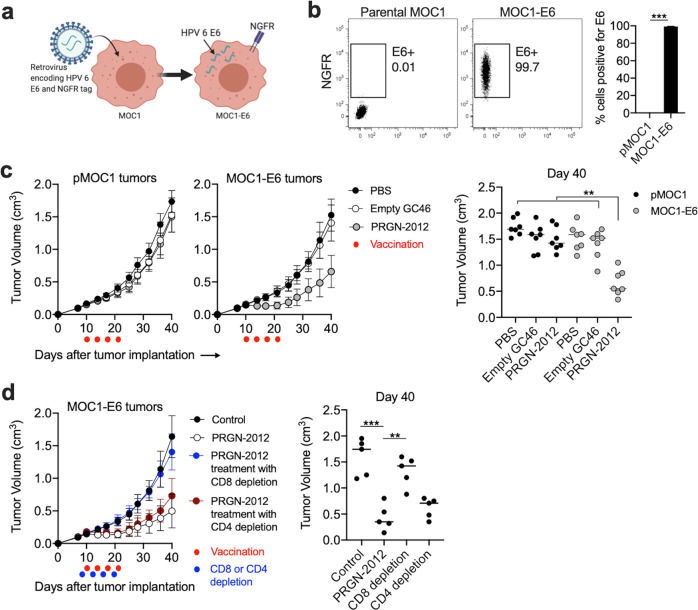
Fig. 4. PRGN-2012 induced tumor growth inhibition of carcinomas engineered to express HPV6 E6.
a Diagram of the retroviral transduction to create MOC1 cells that express HPV6 E6. b Flow cytometry dot plots demonstrating E6 (NGFR) positivity in parental MOC1 or MOC1-E6 cells, quantified on the right. c Summary tumor growth curves of mice bearing parental MOC1 or MOC1-E6 tumors (n = 7 mice/group) treated with PRGN-2012, empty C46 or control (PBS). Red dots indicated treatments. Day 40 tumor volumes are individually quantified on the right. d Summary growth curves of mice bearing MOC1-E6 tumors treated with PRGN-2012 in the presence or absence of CD8 or CD4 depleting antibodies. Red dots indicate treatments and blue dots indicate depletions. Day 40 tumor volumes are individually quantified on the right. Similar results were observed in two independent experiments. NGFR nerve growth factor receptor. **p < 0.01; ***p < 0.001; Student’s t test or ANOVA.

