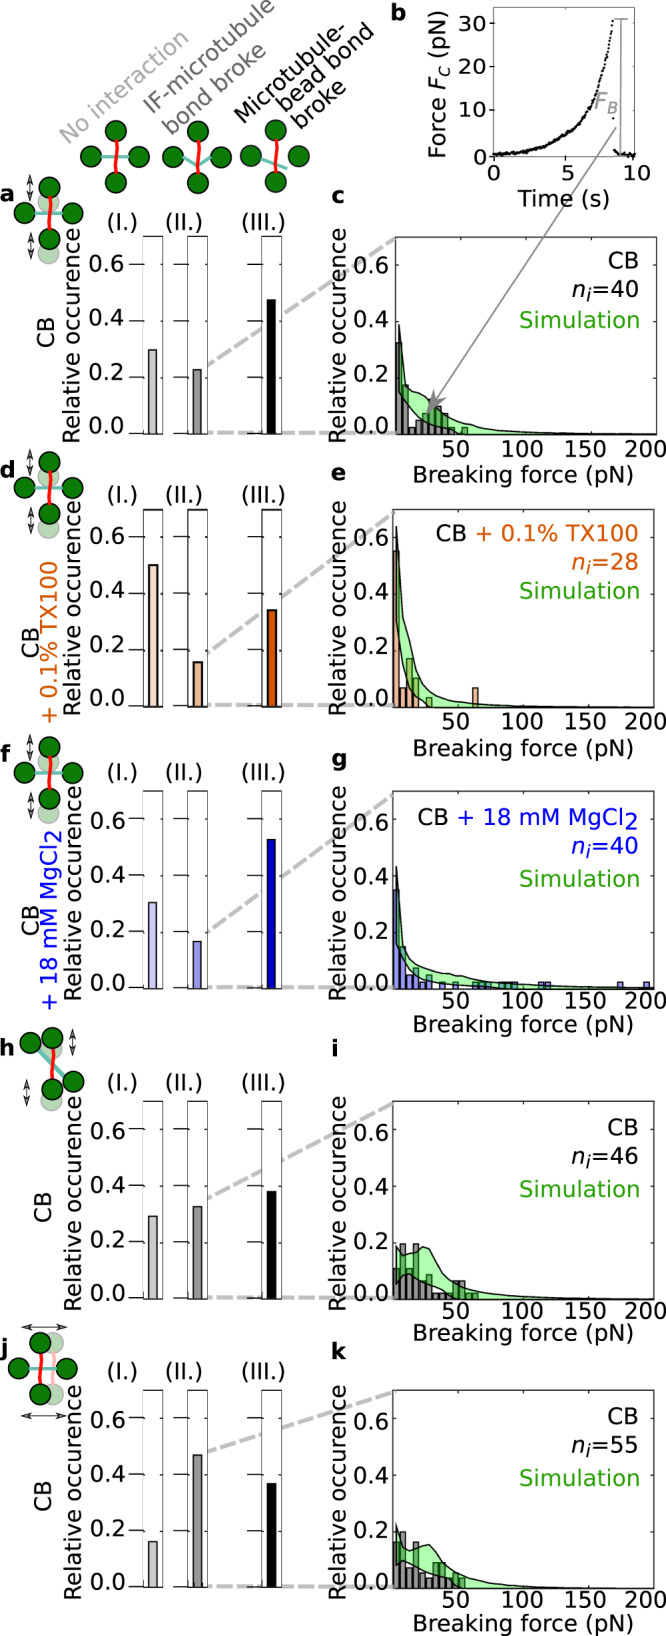
Fig. 3. Hydrophobicity and electrostatics contribute to the IF-microtubule interactions.

a We classified the interactions between IF-microtubule pairs into three different groups as shown by the pictograms: no interaction (I.), breaking of the IF-microtubule bond as shown in Fig. 2b, e, and f (II.), and breaking of the microtubule-bead bond as shown in Fig. 2c (III.). b Typical experimental force-time behavior of the IF-microtubule bond showing the total force acting on the IF-microtubule bond, FC. The plot represents the corrected version of the force data shown in Fig. 2d taking into account the geometry of the filament configuration. c Histograms of ni experimentally recorded breaking forces (gray) and simulated data (green) for the measurements in pure CB when the IF-microtubule interaction broke as shown in Fig. 2b. Due to statistical fluctuations, the distribution appears to be bimodal; however, it can still be well described with a unimodal distribution. d TX100 (orange) suppresses some of the interactions, which results in more IF-microtubule pairs without any interaction (aI. vs. dI.) and fewer instances of IF-microtubule interactions (aII. and III. vs. dII. and III.). e The IF-microtubule bonds formed in the presence of TX100 break at lower forces. f Magnesium (blue) does not change the relative number of IF-microtubule pairs that do not interact (aI. vs. fI.), but leads to fewer IF-microtubule breaking events (aII. vs. fII.) because the interactions become so strong that the microtubule breaks off the bead more often (aIII. vs. fIII.). g The IF-microtubule bonds formed in the presence of additional magnesium break at higher forces. h When the microtubule was turned by 45∘, IF and microtubule interacted more frequently (hII. vs. aII.). i The corresponding distribution of the breaking forces resembles the distribution for the perpendicular geometry (see c). j, k The binding rate for a horizontal movement of the IF increases compared to a vertical movement (jII. vs. aII.). k The corresponding distribution of breaking forces is similar to the distributions for the other two geometries (see i and c). Source data are provided as a Source Data file.
