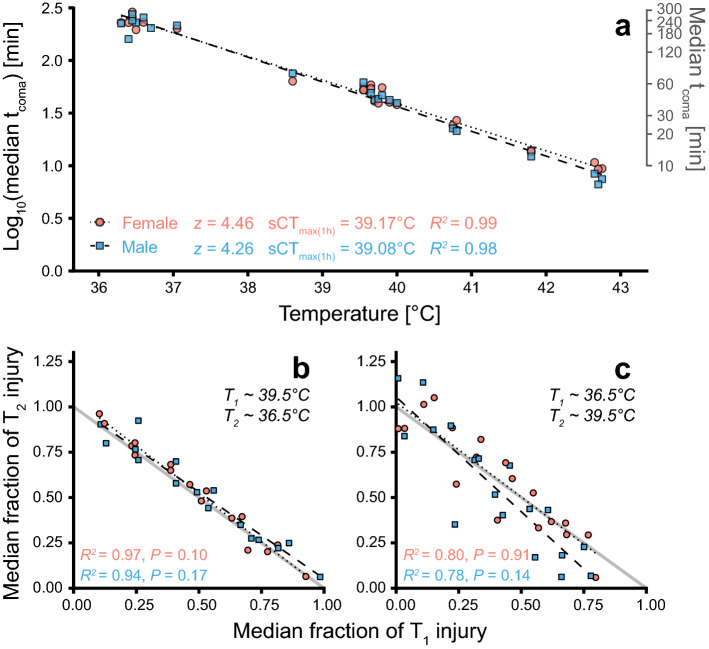
Figure 3.
Thermal death time curves and test of injury additivity between two temperatures. (A) Flies were exposed to a static stressful temperature until coma onset (tcoma). Each point is the median tcoma of a group (n = 2–10) and TDT curves are made for each sex by linear regressions of median log10(tcoma) vs. assay temperature. (B) Groups of flies (n = 5–6 per sex) were exposed to a high temperature (~ 39.5 °C) and then, after different durations, transferred to a lower temperature (~ 36.5 °C) where median tcoma was recorded. The exposures are shown as fractions of injury resulting in coma at T1 (x-axis) and T2 (y-axis), where small and large fractions indicate brief and long exposures, respectively (i.e. brief exposure results in small accumulation of injury relative to the critical amount of injury). If injury acquired at two different temperatures is additive, the two fractions should sum to 1, i.e. follow the (full) line of additivity. (C) A similar experiment as (B), but with initial exposure to ~ 36.5 °C and the subsequent exposure to ~ 39.5 °C.

