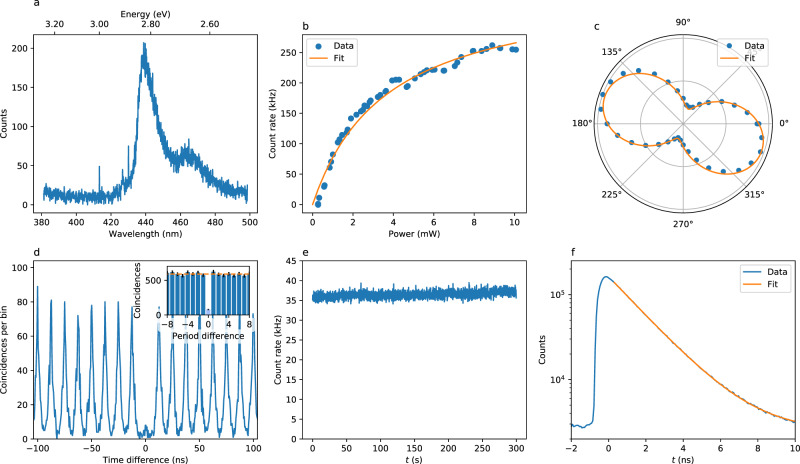
Fig. 2. Photophysical characterization of an individual SPE at room temperature.
a Emission spectrum of SPE1, showing a main peak centred at 440 nm (ZPL) and a phonon replica at 465 nm. b Count rate as a function of the laser power in cw regime. The orange curve is a fit to the data, from which we extract a saturation power of 3.7 mW and a maximum photon detection rate of 3.6 × 10⁵ Hz. c Count rate as a function of the angle of a polarizer placed before the detector, showing linearly polarized emission. The orange curve is a sine fit of the data. d Photon correlations in pulsed regime measured with 315 μW excitation power and 80 MHz repetition rate, yielding g(2)(0) = 0.12 ± 0.01 and thus demonstrating single photon emission. Inset: period-wise integrated coincidences (error bars: 1 standard deviation). The dashed orange line denotes the classical limit. e Time trace of the photon detection rate with 100 ms binning, calculated from the same raw data as (d). f Fluorescence decay in logarithmic scale, extracted from the same raw data as (d). The orange curve is an exponential fit to the data, yielding τ = 1.85 ns.

