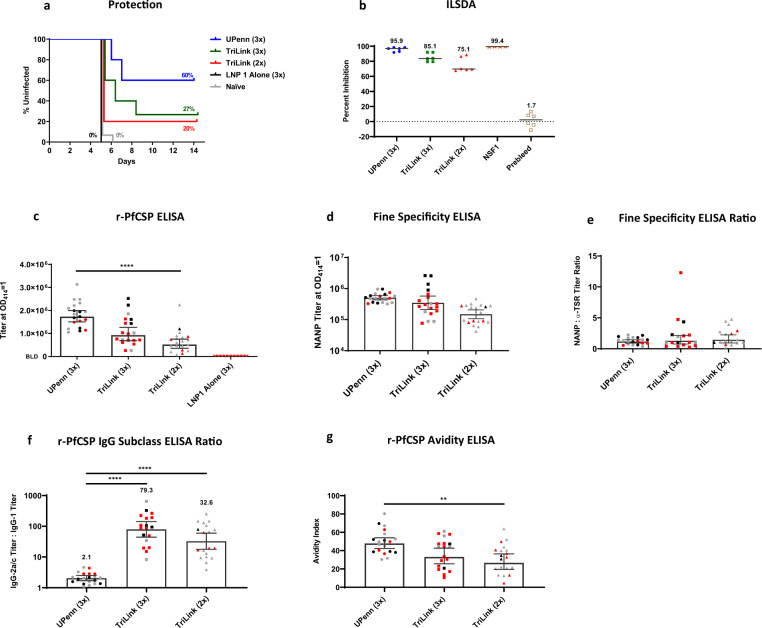
Fig. 4. PfCSP mRNA-LNP1 induced responses in C57BL6.
A 10 μg dose of PfCSP mRNA-LNP1, TriLink, and UPenn, prime:boost (2x) or prime:boost:boost (3x) regimen on a 3-week interval was tested against Pb(ANKA)-PfCSP (Wellcome) transgenic parasites (N = 15 per group for TriLink 3x and naïve controls) (N = 10, UPenn 3x) (N = 5 per group for TriLink 2x and LNP1 alone) with 1000 sporozoites injected intravenously, 2 weeks post final immunization. a Kaplan–Meier curves report the percent survival of challenged mice. Efficacy was calculated against the negative controls (LNP1 alone and naïve controls). Survival was defined as mice without detectable parasitemia by thin blood smear by day 14. b Functional activity of the antibodies was quantified by the ILSDA using pooled mouse serum of each group. Inhibition was calculated relative to the mean of sporozoite invasion in the absence of mouse serum. Data are reported as the mean of assay replicates. c r-PfCSP ELISA (N = 20 per group for UPenn 3x, TriLink 2x) (N = 19, TriLink 3x) (N = 10, LNP1 alone), d fine specificity ELISA against the (NANP)6 repeat peptide (N = 20 per group for UPenn 3x, TriLink 2x) (N = 19, TriLink 3x), e fine specificity ELISA are reported as the ratio of the (NANP)6 titer to the α-TSR titer (N = 20, UPenn) (N = 17 per group for TriLink 3x, TriLink 2x), f the ratio of r-PfCSP IgG subclass titers for IgG1 and IgG2a (N = 20, UPenn 3x) (N = 18, TriLink 3x) (N = 19, TriLink 2x) and g r-PfCSP avidity ELISA (N = 20, UPenn 3x) (N = 19 per group for TriLink 3x, TriLink 2x). Uninfected, infected, and unchallenged mice are represented by black, red, and gray symbols, respectively. Data in the bar graph are reported as the GM with 95% CI. All statistical analyses were performed using one-way ANOVA on ranks, Kruskal–Wallis post hoc Dunn’s multiple comparison test (**p < 0.01; ****p < 0.0001).

